| Red | Green | Blue | |
| z | 17.64 | ||
| znorm | Inf | ||
| sky | -Inf | -Inf | -Inf |
| S/N | 22.6 | 40.3 | 40.6 |
| S/N(c) | 0.0 | 0.0 | 0.0 |
| SN(E/C) |

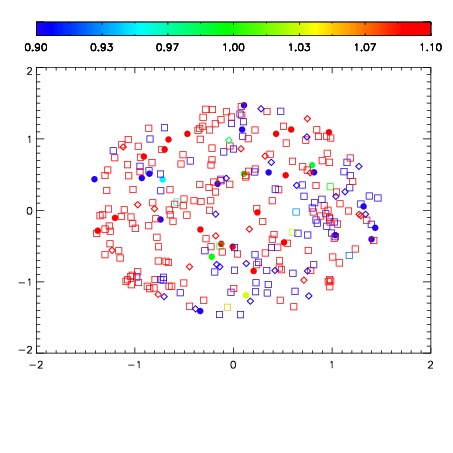
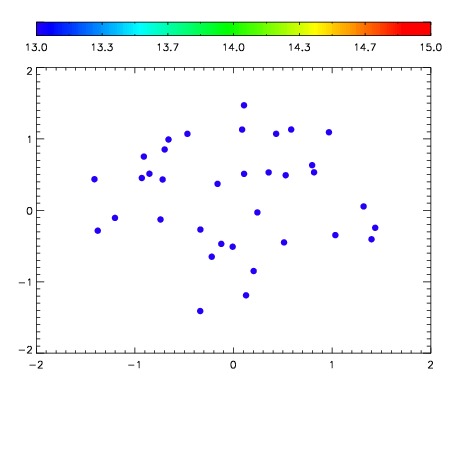

| Frame | Nreads | Zeropoints | Mag plots | Spatial mag deviation | Spatial sky 16325A emission deviations (filled: sky, open: star) | Spatial sky continuum emission | Spatial sky telluric CO2 absorption deviations (filled: H < 10) | |||||||||||||||||||||||
| 0 | 0 |
|
|
|
|
|
|
| IPAIR | NAME | SHIFT | NEWSHIFT | S/N | NAME | SHIFT | NEWSHIFT | S/N |
| 0 | 11680015 | 0.492006 | 0.00000 | 18.9261 | 11680014 | -0.00151715 | 0.493523 | 18.8710 |
| 1 | 11680016 | 0.491884 | 0.000122011 | 18.9618 | 11680017 | -0.000886836 | 0.492893 | 19.0132 |
| 2 | 11680011 | 0.490328 | 0.00167799 | 18.8089 | 11680010 | 0.00000 | 0.492006 | 18.7372 |
| 3 | 11680012 | 0.491041 | 0.000964999 | 18.7744 | 11680013 | -0.00149691 | 0.493503 | 18.7150 |