| Red | Green | Blue | |
| z | 17.64 | ||
| znorm | Inf | ||
| sky | -NaN | -NaN | -Inf |
| S/N | 26.1 | 44.8 | 47.1 |
| S/N(c) | 0.0 | 0.0 | 0.0 |
| SN(E/C) |
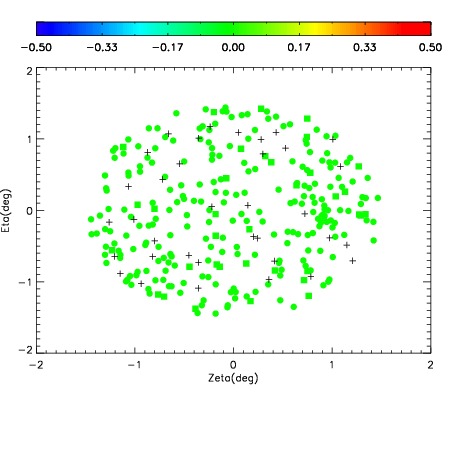
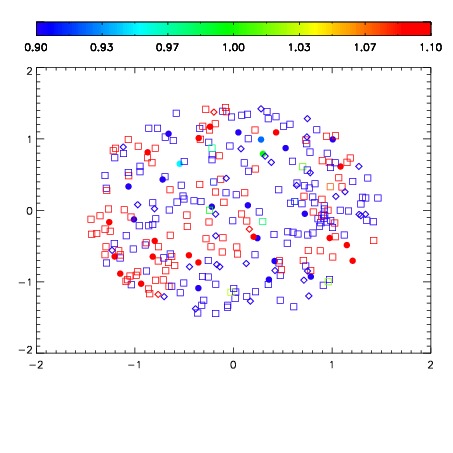
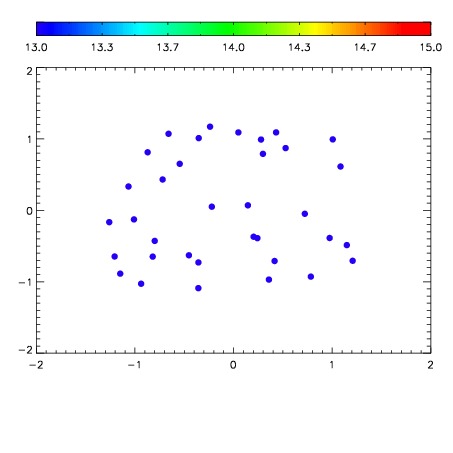

| Frame | Nreads | Zeropoints | Mag plots | Spatial mag deviation | Spatial sky 16325A emission deviations (filled: sky, open: star) | Spatial sky continuum emission | Spatial sky telluric CO2 absorption deviations (filled: H < 10) | |||||||||||||||||||||||
| 0 | 0 |
|
|
|
|
|
|
| IPAIR | NAME | SHIFT | NEWSHIFT | S/N | NAME | SHIFT | NEWSHIFT | S/N |
| 0 | 11130039 | 0.484796 | 0.00000 | 19.0368 | 11130040 | -0.00237908 | 0.487175 | 19.0790 |
| 1 | 11130035 | 0.484311 | 0.000484973 | 18.9793 | 11130036 | -0.00229315 | 0.487089 | 18.9401 |
| 2 | 11130038 | 0.483445 | 0.00135100 | 18.8906 | 11130033 | 0.00000 | 0.484796 | 18.8821 |
| 3 | 11130034 | 0.484534 | 0.000261992 | 18.7850 | 11130037 | -0.00209382 | 0.486890 | 18.8460 |