| Red | Green | Blue | |
| z | 17.64 | ||
| znorm | Inf | ||
| sky | -NaN | -NaN | -Inf |
| S/N | 23.7 | 38.5 | 42.1 |
| S/N(c) | 0.0 | 0.0 | 0.0 |
| SN(E/C) |
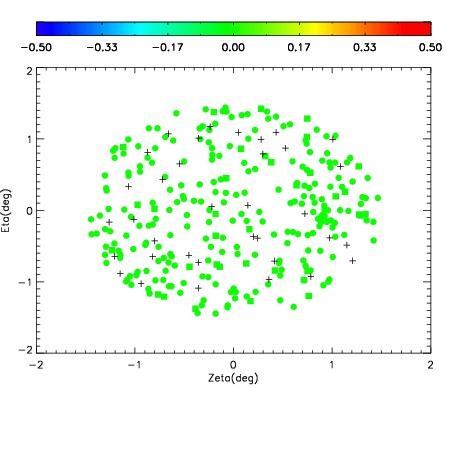
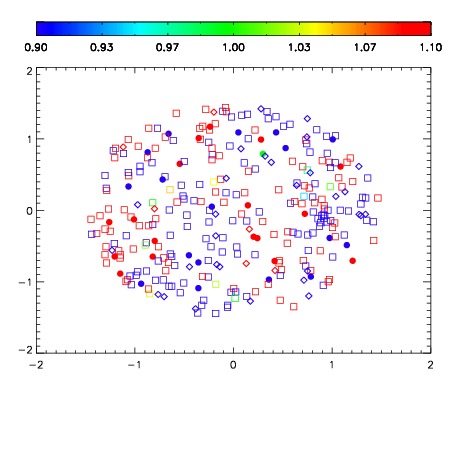
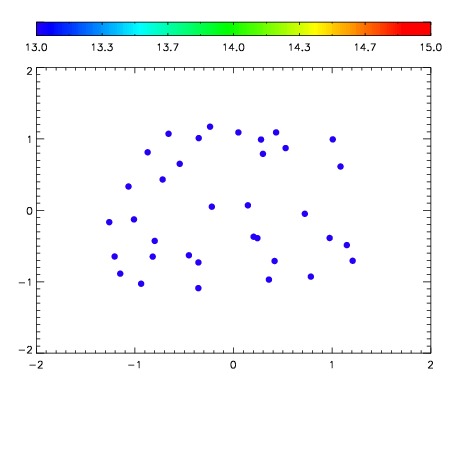

| Frame | Nreads | Zeropoints | Mag plots | Spatial mag deviation | Spatial sky 16325A emission deviations (filled: sky, open: star) | Spatial sky continuum emission | Spatial sky telluric CO2 absorption deviations (filled: H < 10) | |||||||||||||||||||||||
| 0 | 0 |
|
|
|
|
|
|
| IPAIR | NAME | SHIFT | NEWSHIFT | S/N | NAME | SHIFT | NEWSHIFT | S/N |
| 0 | 11350027 | 0.480006 | 0.00000 | 18.8684 | 11350024 | -0.00145131 | 0.481457 | 18.8924 |
| 1 | 11350023 | 0.477910 | 0.00209600 | 18.8718 | 11350028 | -0.000358959 | 0.480365 | 18.9229 |
| 2 | 11350026 | 0.479228 | 0.000778019 | 18.8486 | 11350025 | -0.00130817 | 0.481314 | 18.8347 |
| 3 | 11350022 | 0.477757 | 0.00224900 | 18.8256 | 11350021 | 0.00000 | 0.480006 | 18.7975 |