| Red | Green | Blue | |
| z | 17.64 | ||
| znorm | Inf | ||
| sky | -NaN | -Inf | -Inf |
| S/N | 27.6 | 44.5 | 48.1 |
| S/N(c) | 0.0 | 0.0 | 0.0 |
| SN(E/C) |

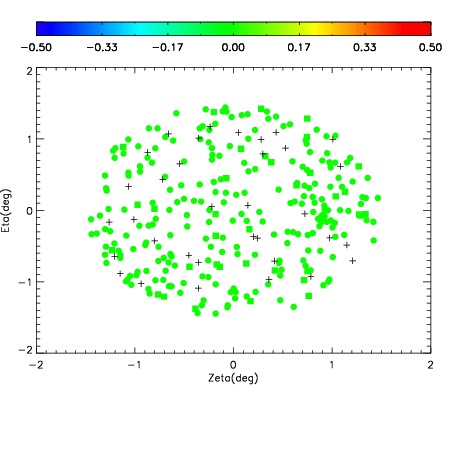
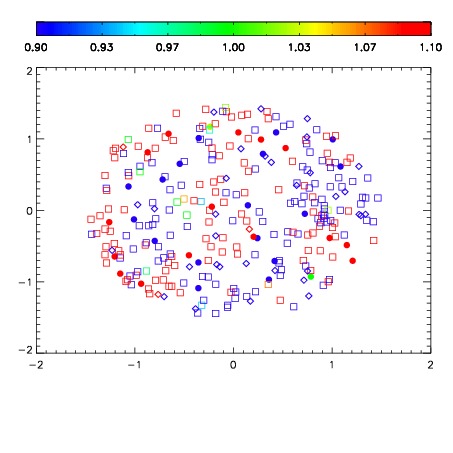
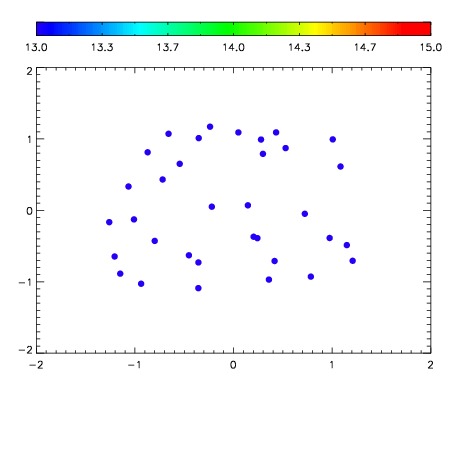

| Frame | Nreads | Zeropoints | Mag plots | Spatial mag deviation | Spatial sky 16325A emission deviations (filled: sky, open: star) | Spatial sky continuum emission | Spatial sky telluric CO2 absorption deviations (filled: H < 10) | |||||||||||||||||||||||
| 0 | 0 |
|
|
|
|
|
|
| IPAIR | NAME | SHIFT | NEWSHIFT | S/N | NAME | SHIFT | NEWSHIFT | S/N |
| 0 | 11380032 | 0.478213 | 0.00000 | 19.1030 | 11380033 | 0.00155687 | 0.476656 | 19.1022 |
| 1 | 11380031 | 0.477391 | 0.000822008 | 19.0644 | 11380029 | -0.000407435 | 0.478620 | 19.0209 |
| 2 | 11380028 | 0.475483 | 0.00273001 | 18.9925 | 11380026 | 0.00000 | 0.478213 | 18.9954 |
| 3 | 11380027 | 0.474699 | 0.00351402 | 18.9644 | 11380030 | 5.68177e-05 | 0.478156 | 18.8690 |