| Red | Green | Blue | |
| z | 17.64 | ||
| znorm | Inf | ||
| sky | -NaN | -NaN | -Inf |
| S/N | 34.7 | 58.9 | 62.6 |
| S/N(c) | 0.0 | 0.0 | 0.0 |
| SN(E/C) |
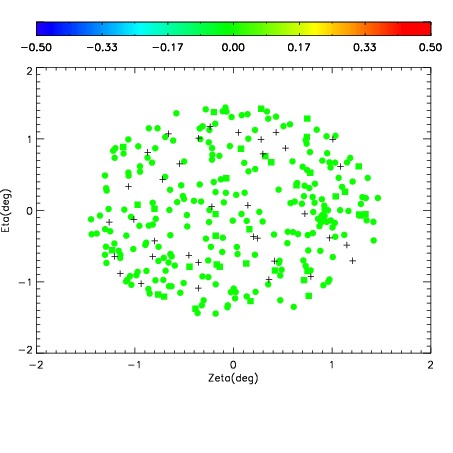
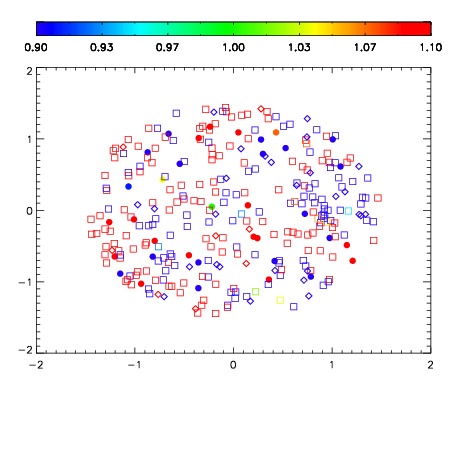
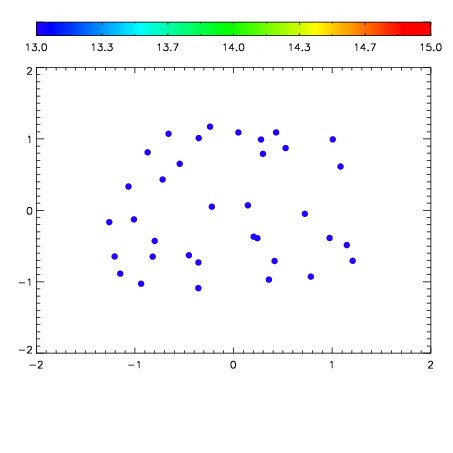

| Frame | Nreads | Zeropoints | Mag plots | Spatial mag deviation | Spatial sky 16325A emission deviations (filled: sky, open: star) | Spatial sky continuum emission | Spatial sky telluric CO2 absorption deviations (filled: H < 10) | |||||||||||||||||||||||
| 0 | 0 |
|
|
|
|
|
|
| IPAIR | NAME | SHIFT | NEWSHIFT | S/N | NAME | SHIFT | NEWSHIFT | S/N |
| 0 | 11660013 | 0.487486 | 0.00000 | 19.1391 | 11660014 | -0.00882825 | 0.496314 | 19.1571 |
| 1 | 11660012 | 0.487252 | 0.000234008 | 19.1035 | 11660015 | -0.00893355 | 0.496420 | 19.1173 |
| 2 | 11660016 | 0.485396 | 0.00209001 | 19.0963 | 11660018 | -0.0109552 | 0.498441 | 19.0801 |
| 3 | 11660017 | 0.486644 | 0.000842005 | 19.0577 | 11660011 | 0.00000 | 0.487486 | 19.0467 |
| 4 | 11660020 | 0.486012 | 0.00147399 | 18.9211 | 11660019 | -0.00999064 | 0.497477 | 19.0242 |
| 5 | 11660021 | 0.486020 | 0.00146601 | 18.8347 | 11660022 | -0.00902127 | 0.496507 | 18.9529 |