| Red | Green | Blue | |
| z | 17.64 | ||
| znorm | Inf | ||
| sky | -Inf | -Inf | -Inf |
| S/N | 27.0 | 48.2 | 51.8 |
| S/N(c) | 0.0 | 0.0 | 0.0 |
| SN(E/C) |
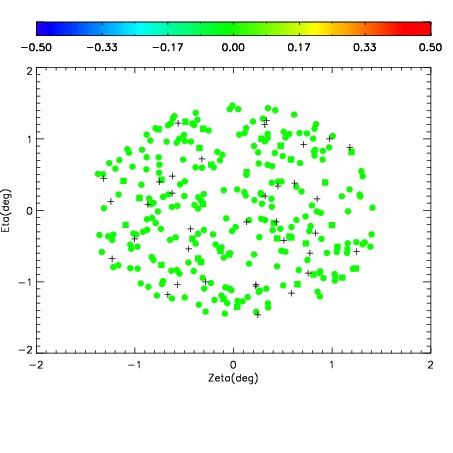
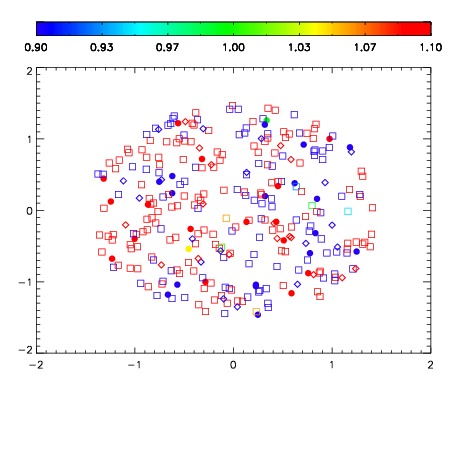
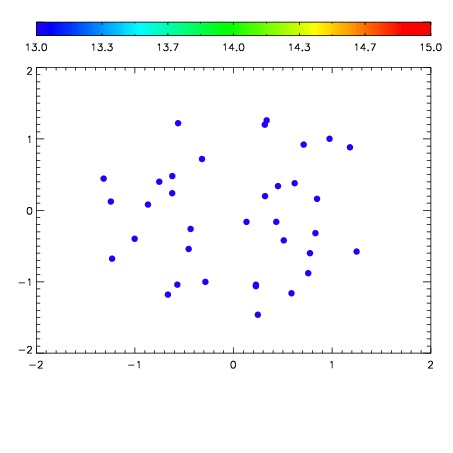

| Frame | Nreads | Zeropoints | Mag plots | Spatial mag deviation | Spatial sky 16325A emission deviations (filled: sky, open: star) | Spatial sky continuum emission | Spatial sky telluric CO2 absorption deviations (filled: H < 10) | |||||||||||||||||||||||
| 0 | 0 |
|
|
|
|
|
|
| IPAIR | NAME | SHIFT | NEWSHIFT | S/N | NAME | SHIFT | NEWSHIFT | S/N |
| 0 | 11440022 | 0.483177 | 0.00000 | 19.0939 | 11440023 | -0.000275658 | 0.483453 | 19.0643 |
| 1 | 11440021 | 0.482084 | 0.00109300 | 19.1116 | 11440024 | -0.000369461 | 0.483546 | 19.0918 |
| 2 | 11440025 | 0.479195 | 0.00398201 | 19.0762 | 11440020 | 0.00000 | 0.483177 | 19.0547 |
| 3 | 11440026 | 0.479938 | 0.00323901 | 19.0175 | 11440027 | 0.00128102 | 0.481896 | 18.9707 |