| Red | Green | Blue | |
| z | 17.64 | ||
| znorm | Inf | ||
| sky | -NaN | -NaN | -Inf |
| S/N | 26.7 | 46.7 | 50.8 |
| S/N(c) | 0.0 | 0.0 | 0.0 |
| SN(E/C) |
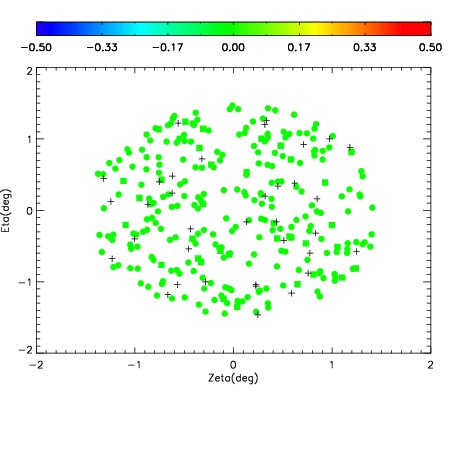
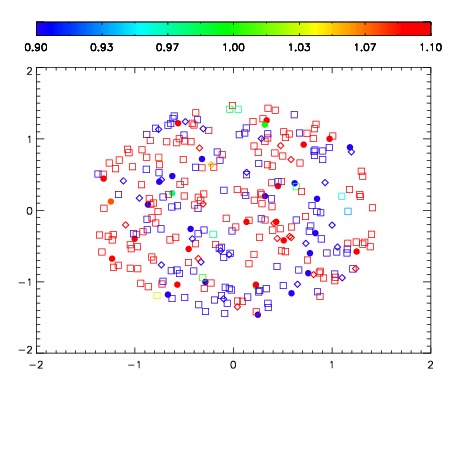
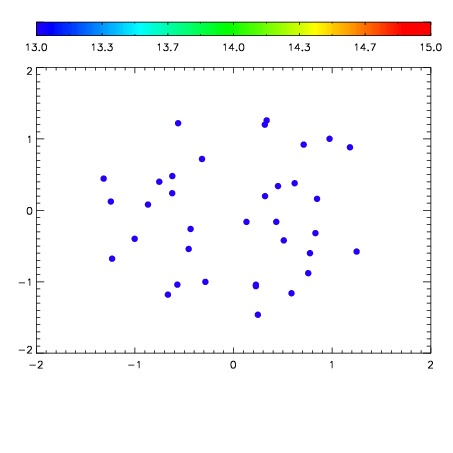

| Frame | Nreads | Zeropoints | Mag plots | Spatial mag deviation | Spatial sky 16325A emission deviations (filled: sky, open: star) | Spatial sky continuum emission | Spatial sky telluric CO2 absorption deviations (filled: H < 10) | |||||||||||||||||||||||
| 0 | 0 |
|
|
|
|
|
|
| IPAIR | NAME | SHIFT | NEWSHIFT | S/N | NAME | SHIFT | NEWSHIFT | S/N |
| 0 | 11660036 | 0.492016 | 0.00000 | 19.0094 | 11660030 | 0.00000 | 0.492016 | 18.9136 |
| 1 | 11660032 | 0.491702 | 0.000313997 | 19.0718 | 11660033 | -0.00607982 | 0.498096 | 19.0525 |
| 2 | 11660035 | 0.491132 | 0.000883996 | 19.0209 | 11660034 | -0.00571611 | 0.497732 | 18.9971 |
| 3 | 11660031 | 0.491560 | 0.000455976 | 18.9887 | 11660037 | -0.00523458 | 0.497251 | 18.9116 |