| Red | Green | Blue | |
| z | 17.64 | ||
| znorm | Inf | ||
| sky | -Inf | -Inf | -Inf |
| S/N | 24.2 | 44.1 | 46.5 |
| S/N(c) | 0.0 | 0.0 | 0.0 |
| SN(E/C) |
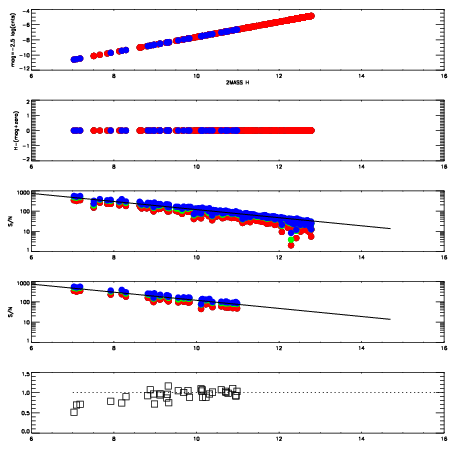
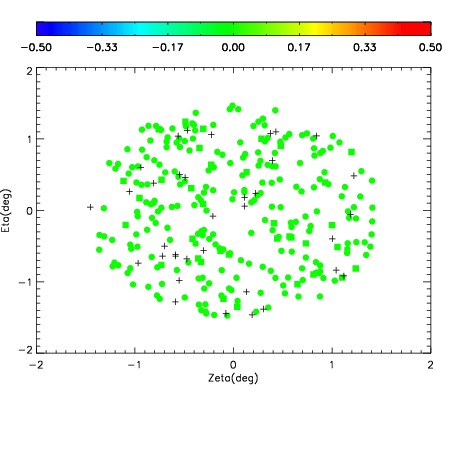
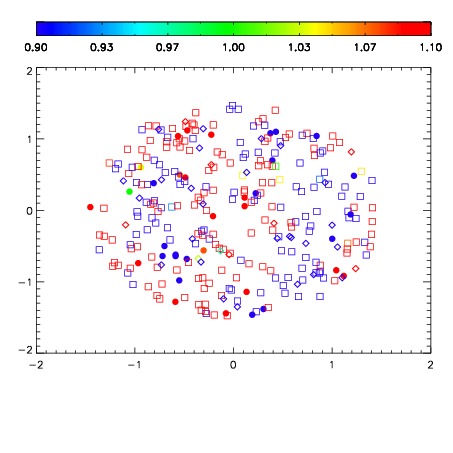
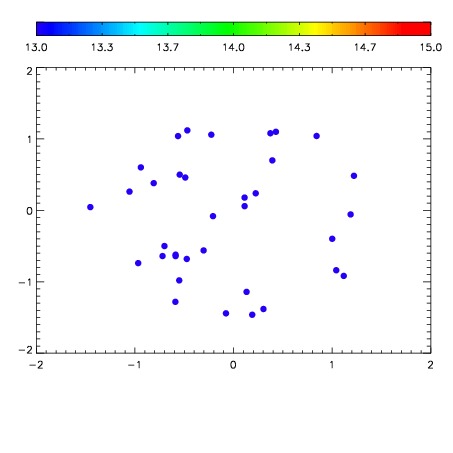

| Frame | Nreads | Zeropoints | Mag plots | Spatial mag deviation | Spatial sky 16325A emission deviations (filled: sky, open: star) | Spatial sky continuum emission | Spatial sky telluric CO2 absorption deviations (filled: H < 10) | |||||||||||||||||||||||
| 0 | 0 |
|
|
|
|
|
|
| IPAIR | NAME | SHIFT | NEWSHIFT | S/N | NAME | SHIFT | NEWSHIFT | S/N |
| 0 | 11670027 | 0.498507 | 0.00000 | 18.5608 | 11670025 | 0.00000 | 0.498507 | 18.3974 |
| 1 | 11670031 | 0.496090 | 0.00241700 | 18.9106 | 11670032 | -0.00173219 | 0.500239 | 18.9190 |
| 2 | 11670030 | 0.495293 | 0.00321400 | 18.8147 | 11670028 | -0.00168231 | 0.500189 | 18.7705 |
| 3 | 11670026 | 0.498298 | 0.000209004 | 18.6648 | 11670029 | -0.00137032 | 0.499877 | 18.7050 |