| Red | Green | Blue | |
| z | 17.64 | ||
| znorm | Inf | ||
| sky | -Inf | -Inf | -Inf |
| S/N | 19.5 | 36.0 | 38.2 |
| S/N(c) | 0.0 | 0.0 | 0.0 |
| SN(E/C) |

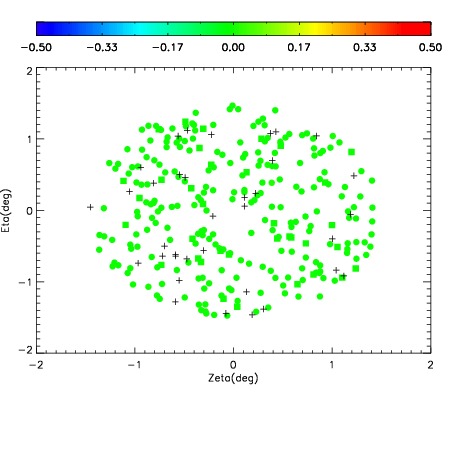
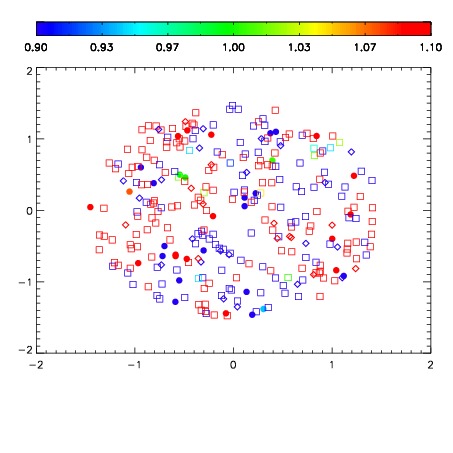


| Frame | Nreads | Zeropoints | Mag plots | Spatial mag deviation | Spatial sky 16325A emission deviations (filled: sky, open: star) | Spatial sky continuum emission | Spatial sky telluric CO2 absorption deviations (filled: H < 10) | |||||||||||||||||||||||
| 0 | 0 |
|
|
|
|
|
|
| IPAIR | NAME | SHIFT | NEWSHIFT | S/N | NAME | SHIFT | NEWSHIFT | S/N |
| 0 | 11710032 | 0.489174 | 0.00000 | 18.8415 | 11710033 | -0.00265213 | 0.491826 | 18.8505 |
| 1 | 11710028 | 0.488086 | 0.00108802 | 18.5849 | 11710030 | -0.00206966 | 0.491244 | 18.7188 |
| 2 | 11710031 | 0.488259 | 0.000915021 | 18.4631 | 11710029 | -0.00143916 | 0.490613 | 18.6830 |
| 3 | 11710027 | 0.488123 | 0.00105101 | 18.3511 | 11710026 | 0.00000 | 0.489174 | 18.6791 |