| Red | Green | Blue | |
| z | 17.64 | ||
| znorm | Inf | ||
| sky | -Inf | -Inf | -Inf |
| S/N | 25.4 | 43.3 | 46.8 |
| S/N(c) | 0.0 | 0.0 | 0.0 |
| SN(E/C) |
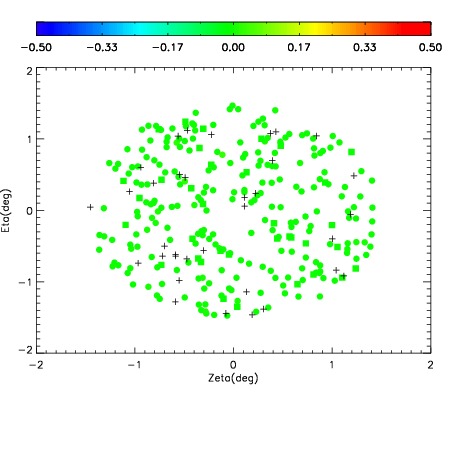
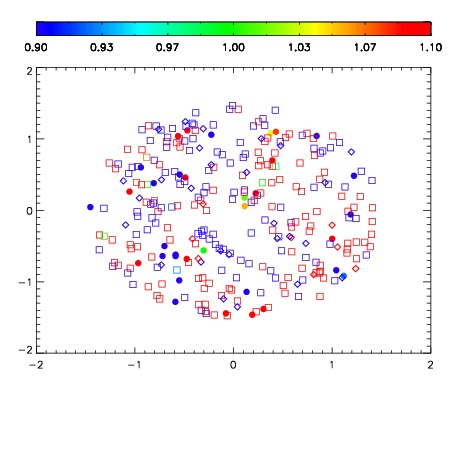
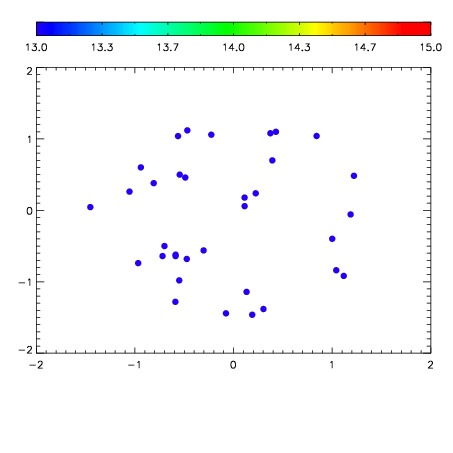

| Frame | Nreads | Zeropoints | Mag plots | Spatial mag deviation | Spatial sky 16325A emission deviations (filled: sky, open: star) | Spatial sky continuum emission | Spatial sky telluric CO2 absorption deviations (filled: H < 10) | |||||||||||||||||||||||
| 0 | 0 |
|
|
|
|
|
|
| IPAIR | NAME | SHIFT | NEWSHIFT | S/N | NAME | SHIFT | NEWSHIFT | S/N |
| 0 | 11950012 | 0.499929 | 0.00000 | 18.7844 | 11950014 | -0.00277386 | 0.502703 | 18.9075 |
| 1 | 11950016 | 0.499855 | 7.39992e-05 | 18.9623 | 11950010 | 0.00000 | 0.499929 | 19.0150 |
| 2 | 11950015 | 0.499395 | 0.000533998 | 18.9388 | 11950017 | -0.00399586 | 0.503925 | 19.0086 |
| 3 | 11950011 | 0.499825 | 0.000104010 | 18.7630 | 11950013 | -0.00277065 | 0.502700 | 18.8827 |