| Red | Green | Blue | |
| z | 17.64 | ||
| znorm | Inf | ||
| sky | -Inf | -Inf | -Inf |
| S/N | 16.3 | 30.1 | 31.1 |
| S/N(c) | 0.0 | 0.0 | 0.0 |
| SN(E/C) |

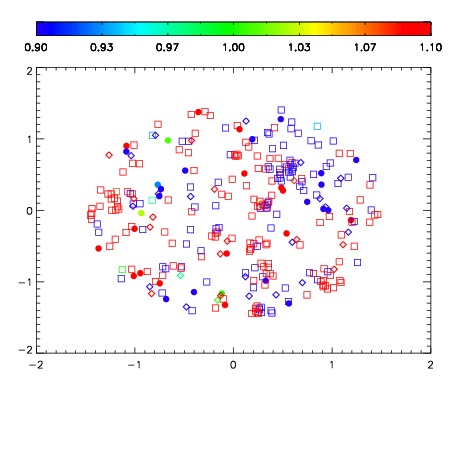
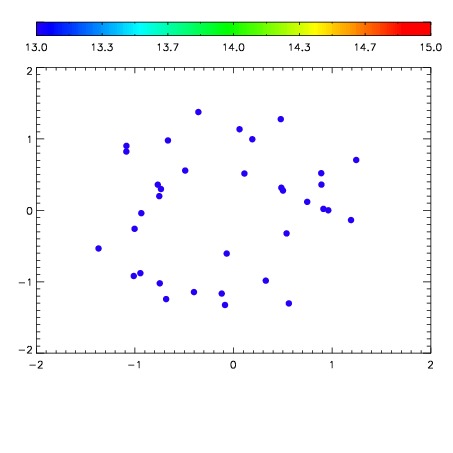

| Frame | Nreads | Zeropoints | Mag plots | Spatial mag deviation | Spatial sky 16325A emission deviations (filled: sky, open: star) | Spatial sky continuum emission | Spatial sky telluric CO2 absorption deviations (filled: H < 10) | |||||||||||||||||||||||
| 0 | 0 |
|
|
|
|
|
|
| IPAIR | NAME | SHIFT | NEWSHIFT | S/N | NAME | SHIFT | NEWSHIFT | S/N |
| 0 | 11080028 | 0.479360 | 0.00000 | 18.3587 | 11080030 | 0.000351103 | 0.479009 | 18.4386 |
| 1 | 11080032 | 0.477181 | 0.00217903 | 18.5784 | 11080033 | -0.000152702 | 0.479513 | 18.5506 |
| 2 | 11080031 | 0.477159 | 0.00220102 | 18.5760 | 11080029 | 0.000590672 | 0.478769 | 18.4451 |
| 3 | 11080027 | 0.478845 | 0.000515014 | 18.1720 | 11080026 | 0.00000 | 0.479360 | 18.3453 |