| Red | Green | Blue | |
| z | 17.64 | ||
| znorm | Inf | ||
| sky | -Inf | -Inf | -Inf |
| S/N | 24.0 | 40.0 | 44.3 |
| S/N(c) | 0.0 | 0.0 | 0.0 |
| SN(E/C) |
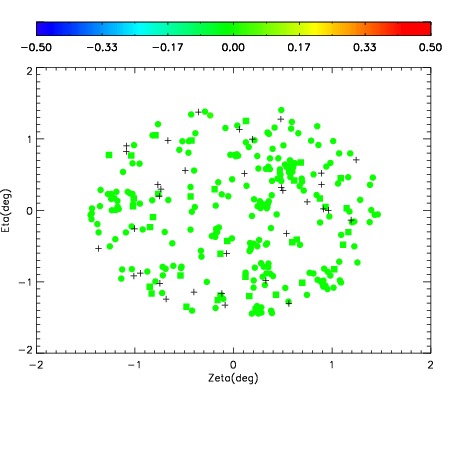
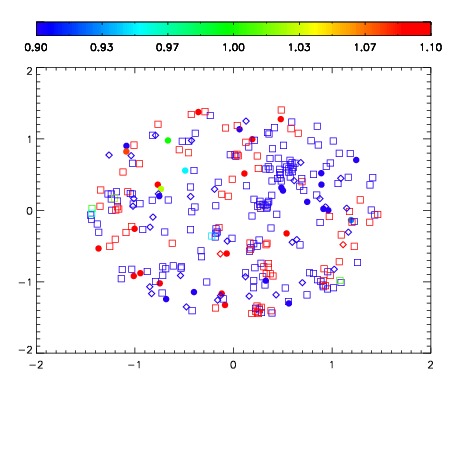
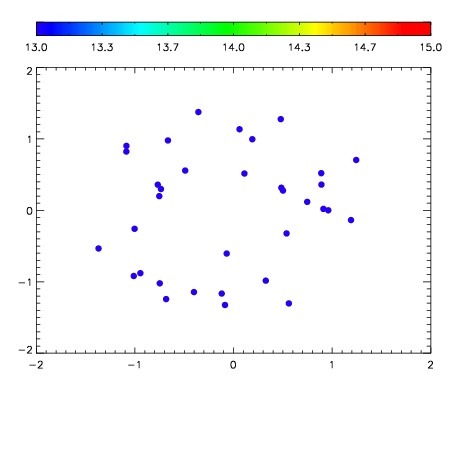

| Frame | Nreads | Zeropoints | Mag plots | Spatial mag deviation | Spatial sky 16325A emission deviations (filled: sky, open: star) | Spatial sky continuum emission | Spatial sky telluric CO2 absorption deviations (filled: H < 10) | |||||||||||||||||||||||
| 0 | 0 |
|
|
|
|
|
|
| IPAIR | NAME | SHIFT | NEWSHIFT | S/N | NAME | SHIFT | NEWSHIFT | S/N |
| 0 | 11120028 | 0.482634 | 0.00000 | 18.9867 | 11120033 | -0.000106880 | 0.482741 | 18.8820 |
| 1 | 11120031 | 0.481843 | 0.000791013 | 19.0196 | 11120029 | -0.00151071 | 0.484145 | 18.9665 |
| 2 | 11120032 | 0.482566 | 6.80089e-05 | 18.9450 | 11120026 | 0.00000 | 0.482634 | 18.8599 |
| 3 | 11120027 | 0.482481 | 0.000153005 | 18.9315 | 11120030 | -0.000962382 | 0.483596 | 18.7170 |