| Red | Green | Blue | |
| z | 17.64 | ||
| znorm | Inf | ||
| sky | -Inf | -NaN | -Inf |
| S/N | 25.2 | 42.9 | 46.4 |
| S/N(c) | 0.0 | 0.0 | 0.0 |
| SN(E/C) |

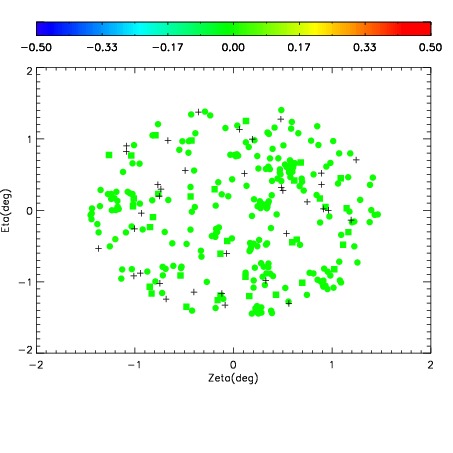
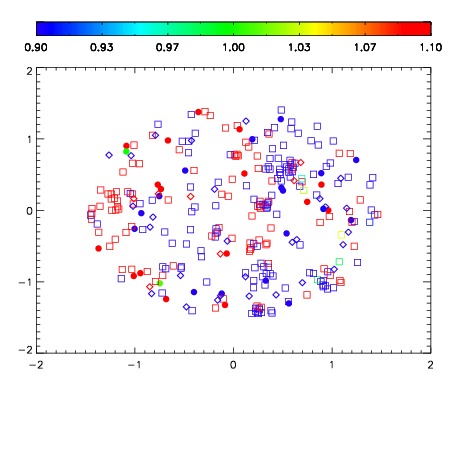


| Frame | Nreads | Zeropoints | Mag plots | Spatial mag deviation | Spatial sky 16325A emission deviations (filled: sky, open: star) | Spatial sky continuum emission | Spatial sky telluric CO2 absorption deviations (filled: H < 10) | |||||||||||||||||||||||
| 0 | 0 |
|
|
|
|
|
|
| IPAIR | NAME | SHIFT | NEWSHIFT | S/N | NAME | SHIFT | NEWSHIFT | S/N |
| 0 | 11380016 | 0.475703 | 0.00000 | 19.0029 | 11380018 | -0.00141958 | 0.477123 | 19.0445 |
| 1 | 11380013 | 0.475255 | 0.000447989 | 19.0132 | 11380015 | -0.000962738 | 0.476666 | 19.0598 |
| 2 | 11380012 | 0.475057 | 0.000645995 | 18.9786 | 11380014 | -0.00119977 | 0.476903 | 19.0283 |
| 3 | 11380017 | 0.475508 | 0.000194997 | 18.9307 | 11380011 | 0.00000 | 0.475703 | 18.9197 |