| Red | Green | Blue | |
| z | 17.64 | ||
| znorm | Inf | ||
| sky | -NaN | -Inf | -Inf |
| S/N | 23.8 | 40.9 | 44.1 |
| S/N(c) | 0.0 | 0.0 | 0.0 |
| SN(E/C) |

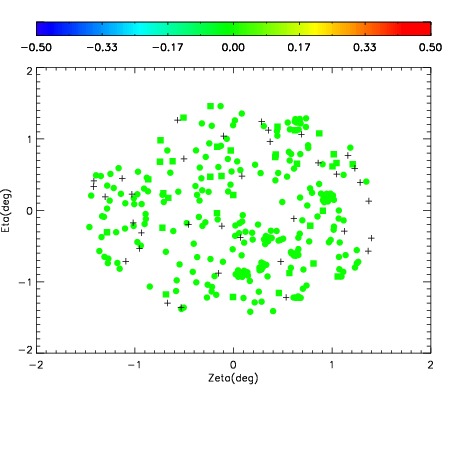
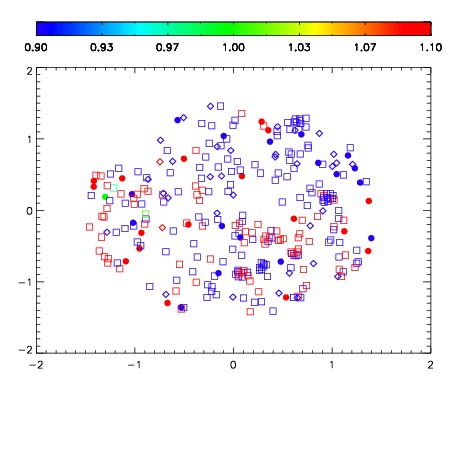
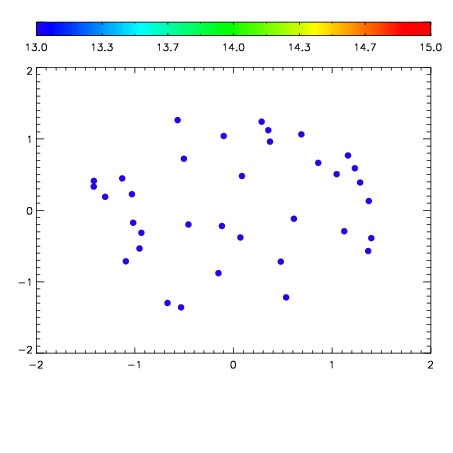

| Frame | Nreads | Zeropoints | Mag plots | Spatial mag deviation | Spatial sky 16325A emission deviations (filled: sky, open: star) | Spatial sky continuum emission | Spatial sky telluric CO2 absorption deviations (filled: H < 10) | |||||||||||||||||||||||
| 0 | 0 |
|
|
|
|
|
|
| IPAIR | NAME | SHIFT | NEWSHIFT | S/N | NAME | SHIFT | NEWSHIFT | S/N |
| 0 | 11100028 | 0.471758 | 0.00000 | 18.9060 | 11100033 | -0.00246297 | 0.474221 | 18.9177 |
| 1 | 11100032 | 0.469015 | 0.00274301 | 18.9594 | 11100026 | 0.00000 | 0.471758 | 18.9258 |
| 2 | 11100031 | 0.468947 | 0.00281101 | 18.9027 | 11100030 | -0.00195851 | 0.473717 | 18.9169 |
| 3 | 11100027 | 0.470891 | 0.000867009 | 18.8267 | 11100029 | -0.00208202 | 0.473840 | 18.8949 |