| Red | Green | Blue | |
| z | 17.64 | ||
| znorm | Inf | ||
| sky | -Inf | -NaN | -NaN |
| S/N | 22.3 | 38.8 | 39.3 |
| S/N(c) | 0.0 | 0.0 | 0.0 |
| SN(E/C) |
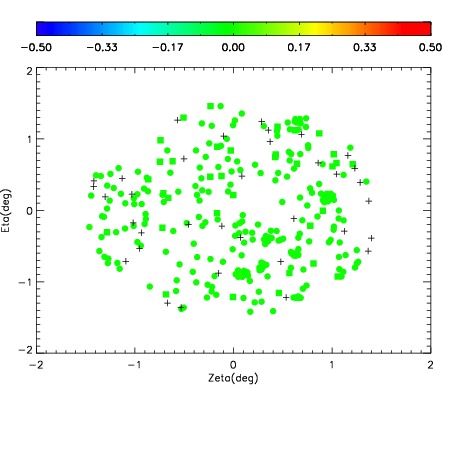
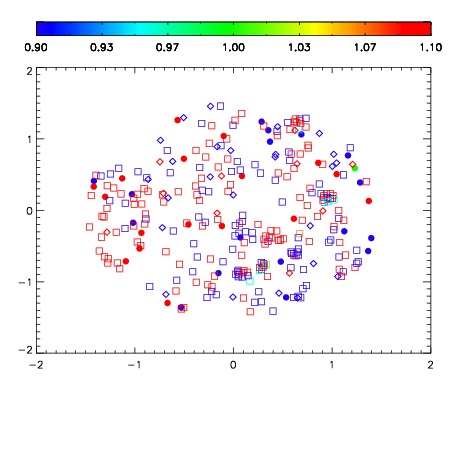
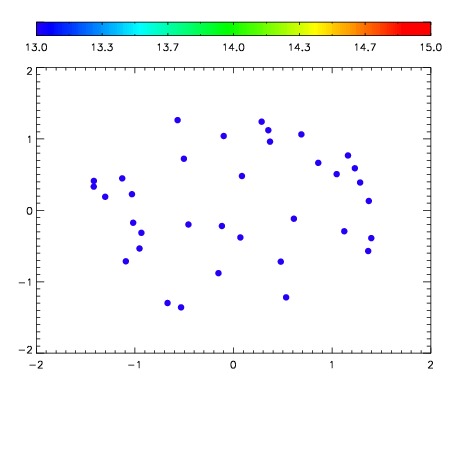

| Frame | Nreads | Zeropoints | Mag plots | Spatial mag deviation | Spatial sky 16325A emission deviations (filled: sky, open: star) | Spatial sky continuum emission | Spatial sky telluric CO2 absorption deviations (filled: H < 10) | |||||||||||||||||||||||
| 0 | 0 |
|
|
|
|
|
|
| IPAIR | NAME | SHIFT | NEWSHIFT | S/N | NAME | SHIFT | NEWSHIFT | S/N |
| 0 | 11140030 | 0.484266 | 0.00000 | 18.8253 | 11140027 | -0.00217482 | 0.486441 | 18.7487 |
| 1 | 11140029 | 0.484014 | 0.000252008 | 18.8429 | 11140024 | 0.00000 | 0.484266 | 18.7782 |
| 2 | 11140025 | 0.483038 | 0.00122800 | 18.7446 | 11140028 | -0.00170633 | 0.485972 | 18.7113 |
| 3 | 11140026 | 0.483206 | 0.00106001 | 18.7165 | 11140031 | -0.000789851 | 0.485056 | 18.7074 |