| Red | Green | Blue | |
| z | 17.64 | ||
| znorm | Inf | ||
| sky | -Inf | -Inf | -Inf |
| S/N | 21.5 | 38.2 | 40.4 |
| S/N(c) | 0.0 | 0.0 | 0.0 |
| SN(E/C) |

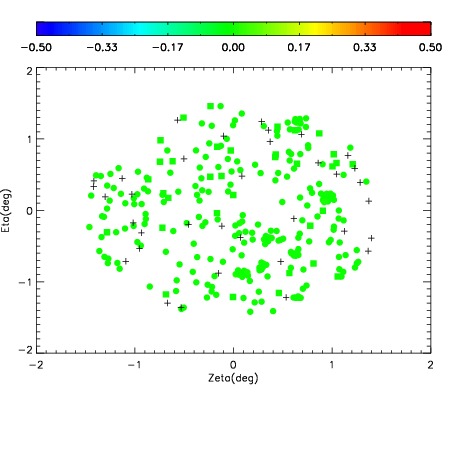
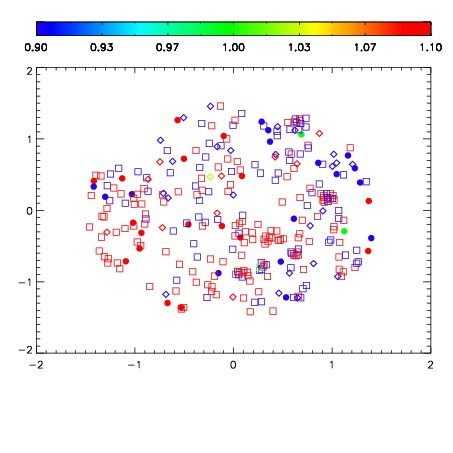
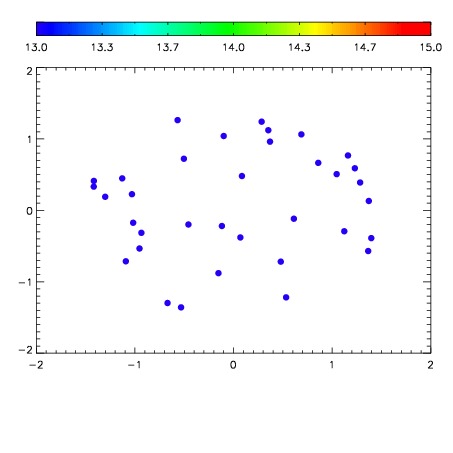

| Frame | Nreads | Zeropoints | Mag plots | Spatial mag deviation | Spatial sky 16325A emission deviations (filled: sky, open: star) | Spatial sky continuum emission | Spatial sky telluric CO2 absorption deviations (filled: H < 10) | |||||||||||||||||||||||
| 0 | 0 |
|
|
|
|
|
|
| IPAIR | NAME | SHIFT | NEWSHIFT | S/N | NAME | SHIFT | NEWSHIFT | S/N |
| 0 | 11640015 | 0.493048 | 0.00000 | 18.5826 | 11640016 | -0.00163055 | 0.494679 | 18.6893 |
| 1 | 11640018 | 0.490870 | 0.00217801 | 18.8173 | 11640020 | -0.00126231 | 0.494310 | 18.7982 |
| 2 | 11640019 | 0.491548 | 0.00150001 | 18.8125 | 11640013 | 0.00000 | 0.493048 | 18.7879 |
| 3 | 11640014 | 0.492620 | 0.000428021 | 18.6381 | 11640017 | -0.00180204 | 0.494850 | 18.7370 |