| Red | Green | Blue | |
| z | 17.64 | ||
| znorm | Inf | ||
| sky | -Inf | -NaN | -Inf |
| S/N | 26.6 | 45.0 | 47.8 |
| S/N(c) | 0.0 | 0.0 | 0.0 |
| SN(E/C) |
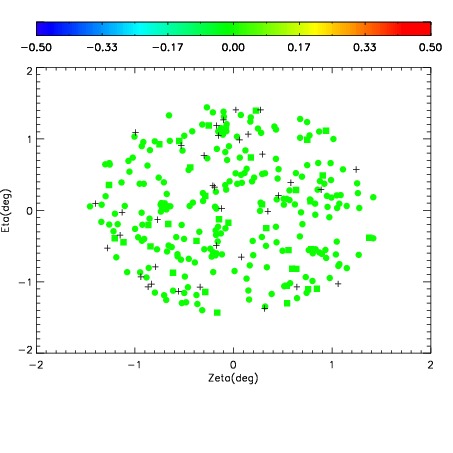
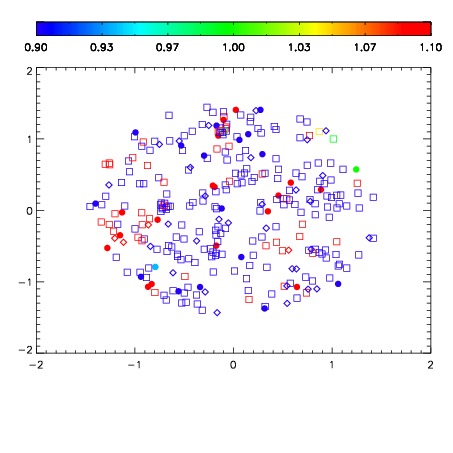
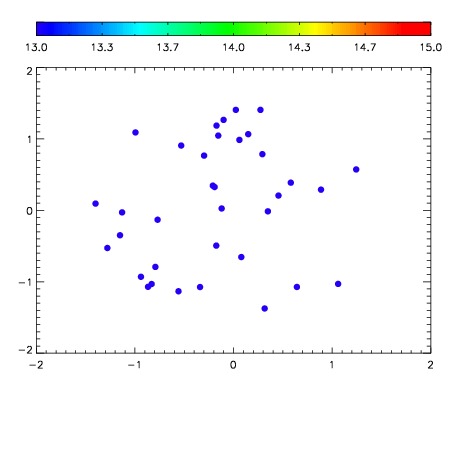

| Frame | Nreads | Zeropoints | Mag plots | Spatial mag deviation | Spatial sky 16325A emission deviations (filled: sky, open: star) | Spatial sky continuum emission | Spatial sky telluric CO2 absorption deviations (filled: H < 10) | |||||||||||||||||||||||
| 0 | 0 |
|
|
|
|
|
|
| IPAIR | NAME | SHIFT | NEWSHIFT | S/N | NAME | SHIFT | NEWSHIFT | S/N |
| 0 | 11100050 | 0.469907 | 0.00000 | 18.9878 | 11100048 | 0.00000 | 0.469907 | 19.0187 |
| 1 | 11100054 | 0.469587 | 0.000319988 | 19.0578 | 11100052 | -0.00219628 | 0.472103 | 19.1464 |
| 2 | 11100049 | 0.468730 | 0.00117698 | 19.0121 | 11100051 | -0.00144469 | 0.471352 | 19.1080 |
| 3 | 11100053 | 0.469493 | 0.000413984 | 19.0071 | 11100055 | -0.00267472 | 0.472582 | 19.0645 |