| Red | Green | Blue | |
| z | 17.64 | ||
| znorm | Inf | ||
| sky | -NaN | -Inf | -Inf |
| S/N | 25.6 | 44.0 | 46.4 |
| S/N(c) | 0.0 | 0.0 | 0.0 |
| SN(E/C) |
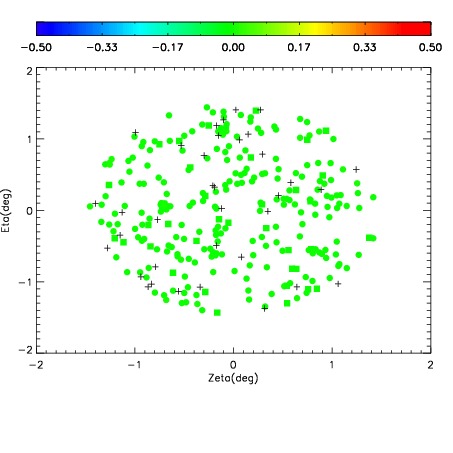
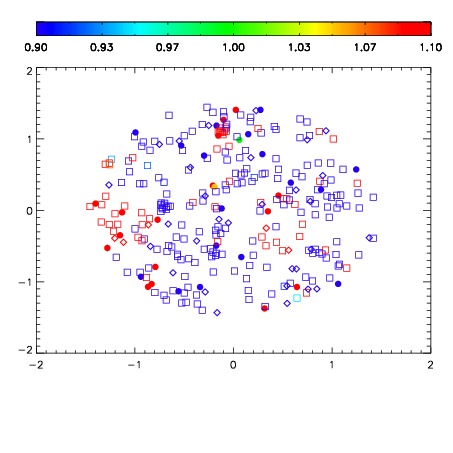
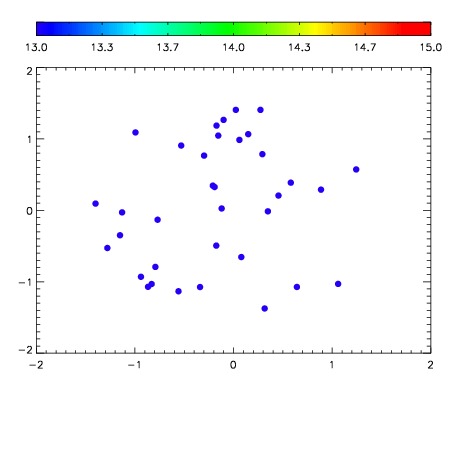

| Frame | Nreads | Zeropoints | Mag plots | Spatial mag deviation | Spatial sky 16325A emission deviations (filled: sky, open: star) | Spatial sky continuum emission | Spatial sky telluric CO2 absorption deviations (filled: H < 10) | |||||||||||||||||||||||
| 0 | 0 |
|
|
|
|
|
|
| IPAIR | NAME | SHIFT | NEWSHIFT | S/N | NAME | SHIFT | NEWSHIFT | S/N |
| 0 | 11140041 | 0.487035 | 0.00000 | 18.9865 | 11140042 | 0.000364172 | 0.486671 | 19.0360 |
| 1 | 11140040 | 0.486150 | 0.000885010 | 19.0011 | 11140038 | 0.000256490 | 0.486779 | 19.0466 |
| 2 | 11140037 | 0.485799 | 0.00123599 | 18.8894 | 11140039 | -9.83757e-05 | 0.487133 | 18.9814 |
| 3 | 11140036 | 0.485603 | 0.00143200 | 18.8543 | 11140035 | 0.00000 | 0.487035 | 18.8683 |