| Red | Green | Blue | |
| z | 17.64 | ||
| znorm | Inf | ||
| sky | -Inf | -Inf | -Inf |
| S/N | 8.9 | 18.6 | 18.6 |
| S/N(c) | 0.0 | 0.0 | 0.0 |
| SN(E/C) |
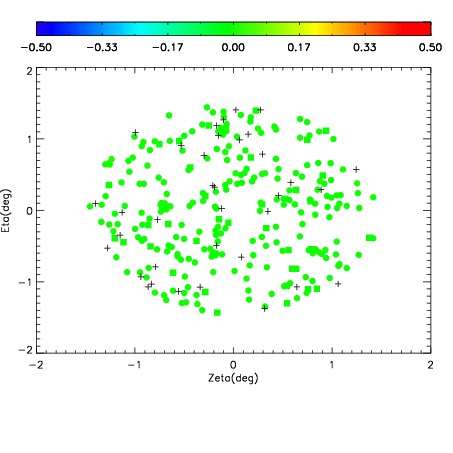
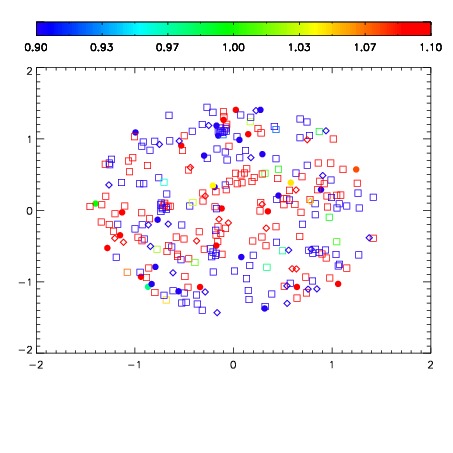
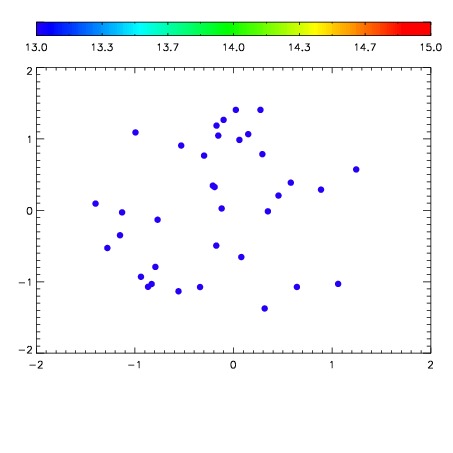

| Frame | Nreads | Zeropoints | Mag plots | Spatial mag deviation | Spatial sky 16325A emission deviations (filled: sky, open: star) | Spatial sky continuum emission | Spatial sky telluric CO2 absorption deviations (filled: H < 10) | |||||||||||||||||||||||
| 0 | 0 |
|
|
|
|
|
|
| IPAIR | NAME | SHIFT | NEWSHIFT | S/N | NAME | SHIFT | NEWSHIFT | S/N |
| 0 | 11160013 | 0.487980 | 0.00000 | 17.5917 | 11160014 | -0.00231210 | 0.490292 | 17.5174 |
| 1 | 11160017 | 0.484479 | 0.00350100 | 17.7502 | 11160015 | -0.00222162 | 0.490202 | 17.6978 |
| 2 | 11160016 | 0.483796 | 0.00418401 | 17.7309 | 11160018 | -0.00148379 | 0.489464 | 17.5760 |
| 3 | 11160012 | 0.487076 | 0.000903994 | 17.3087 | 11160011 | 0.00000 | 0.487980 | 17.1183 |