| Red | Green | Blue | |
| z | 17.64 | ||
| znorm | Inf | ||
| sky | -Inf | -Inf | -Inf |
| S/N | 20.8 | 37.5 | 40.3 |
| S/N(c) | 0.0 | 0.0 | 0.0 |
| SN(E/C) |
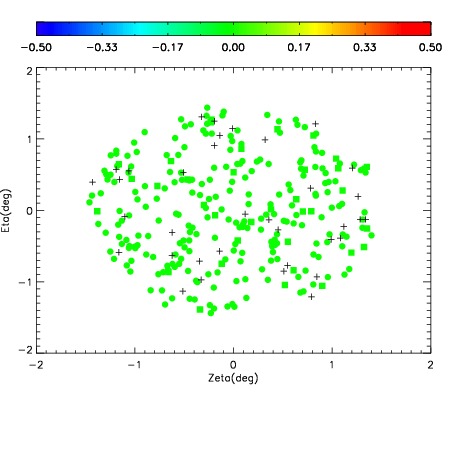
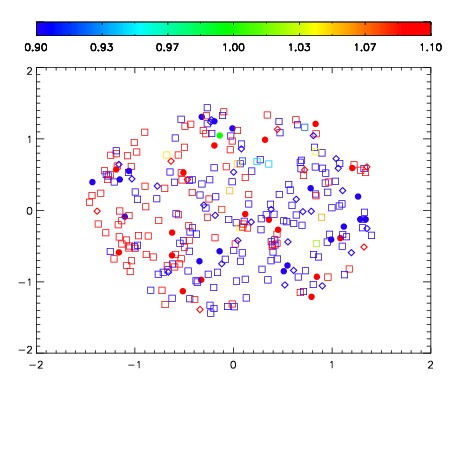


| Frame | Nreads | Zeropoints | Mag plots | Spatial mag deviation | Spatial sky 16325A emission deviations (filled: sky, open: star) | Spatial sky continuum emission | Spatial sky telluric CO2 absorption deviations (filled: H < 10) | |||||||||||||||||||||||
| 0 | 0 |
|
|
|
|
|
|
| IPAIR | NAME | SHIFT | NEWSHIFT | S/N | NAME | SHIFT | NEWSHIFT | S/N |
| 0 | 11450013 | 0.474800 | 0.00000 | 18.7525 | 11450014 | -0.00173367 | 0.476534 | 18.7427 |
| 1 | 11450012 | 0.473304 | 0.00149599 | 18.8536 | 11450011 | 0.00000 | 0.474800 | 18.8624 |
| 2 | 11450016 | 0.473546 | 0.00125399 | 18.4967 | 11450015 | -0.00206549 | 0.476865 | 18.7228 |
| 3 | 11450017 | 0.474283 | 0.000516981 | 18.4847 | 11450018 | -0.00320988 | 0.478010 | 18.4291 |