| Red | Green | Blue | |
| z | 17.64 | ||
| znorm | Inf | ||
| sky | -Inf | -NaN | -Inf |
| S/N | 30.4 | 48.3 | 53.6 |
| S/N(c) | 0.0 | 0.0 | 0.0 |
| SN(E/C) |
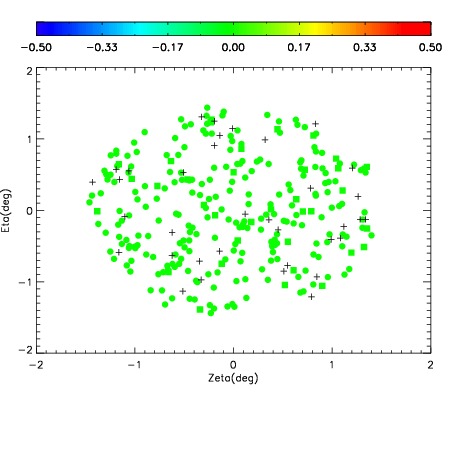
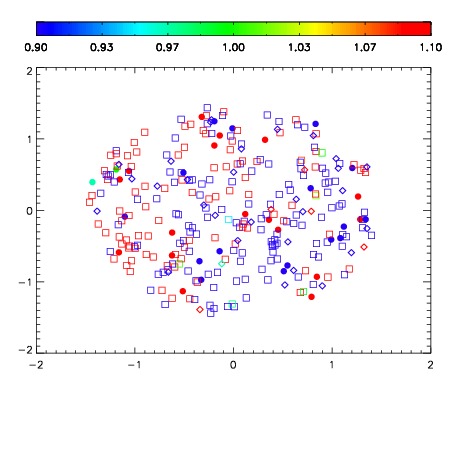
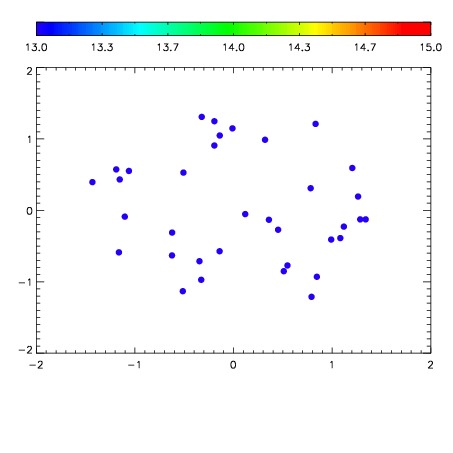

| Frame | Nreads | Zeropoints | Mag plots | Spatial mag deviation | Spatial sky 16325A emission deviations (filled: sky, open: star) | Spatial sky continuum emission | Spatial sky telluric CO2 absorption deviations (filled: H < 10) | |||||||||||||||||||||||
| 0 | 0 |
|
|
|
|
|
|
| IPAIR | NAME | SHIFT | NEWSHIFT | S/N | NAME | SHIFT | NEWSHIFT | S/N |
| 0 | 11650013 | 0.495539 | 0.00000 | 19.1102 | 11650014 | -0.00131617 | 0.496855 | 19.1327 |
| 1 | 11650017 | 0.493246 | 0.00229302 | 19.1942 | 11650018 | -0.00216799 | 0.497707 | 19.2021 |
| 2 | 11650016 | 0.492144 | 0.00339502 | 19.1876 | 11650015 | -0.00109228 | 0.496631 | 19.1652 |
| 3 | 11650012 | 0.495321 | 0.000218004 | 19.0784 | 11650011 | 0.00000 | 0.495539 | 19.0179 |