| Red | Green | Blue | |
| z | 17.64 | ||
| znorm | Inf | ||
| sky | -Inf | -NaN | -Inf |
| S/N | 23.8 | 40.0 | 44.3 |
| S/N(c) | 0.0 | 0.0 | 0.0 |
| SN(E/C) |
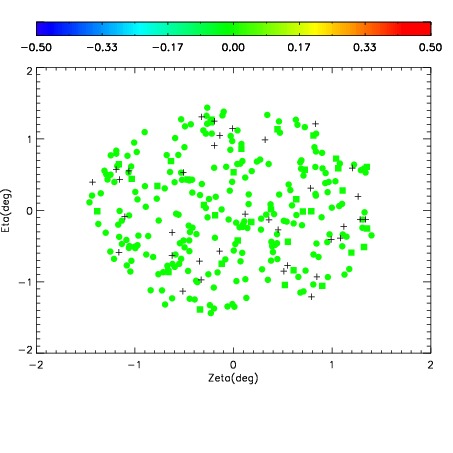
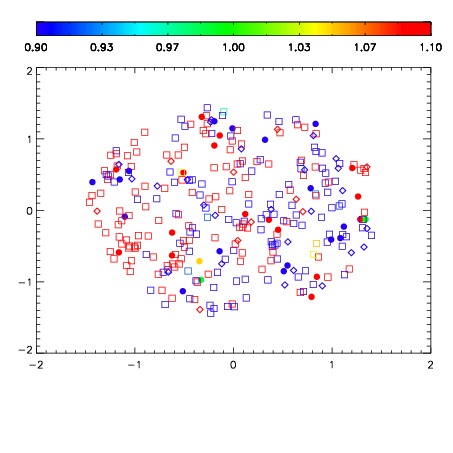
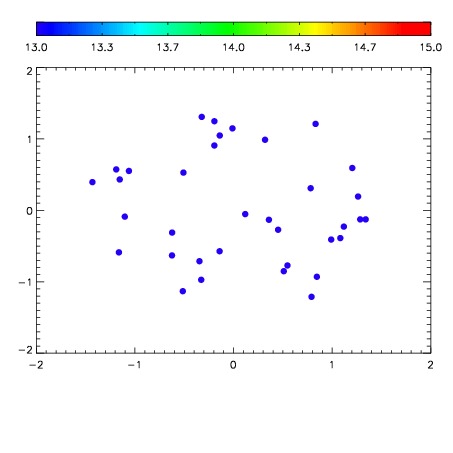

| Frame | Nreads | Zeropoints | Mag plots | Spatial mag deviation | Spatial sky 16325A emission deviations (filled: sky, open: star) | Spatial sky continuum emission | Spatial sky telluric CO2 absorption deviations (filled: H < 10) | |||||||||||||||||||||||
| 0 | 0 |
|
|
|
|
|
|
| IPAIR | NAME | SHIFT | NEWSHIFT | S/N | NAME | SHIFT | NEWSHIFT | S/N |
| 0 | 11710013 | 0.487632 | 0.00000 | 18.8425 | 11710015 | -0.00247161 | 0.490104 | 18.8388 |
| 1 | 11710016 | 0.487396 | 0.000236005 | 18.8514 | 11710014 | -0.00258776 | 0.490220 | 18.9126 |
| 2 | 11710017 | 0.487274 | 0.000358015 | 18.7635 | 11710011 | 0.00000 | 0.487632 | 18.8090 |
| 3 | 11710012 | 0.487034 | 0.000598013 | 18.7607 | 11710018 | -0.00390759 | 0.491540 | 18.7428 |