| Red | Green | Blue | |
| z | 17.64 | ||
| znorm | Inf | ||
| sky | -Inf | -Inf | -Inf |
| S/N | 20.7 | 36.6 | 37.0 |
| S/N(c) | 0.0 | 0.0 | 0.0 |
| SN(E/C) |
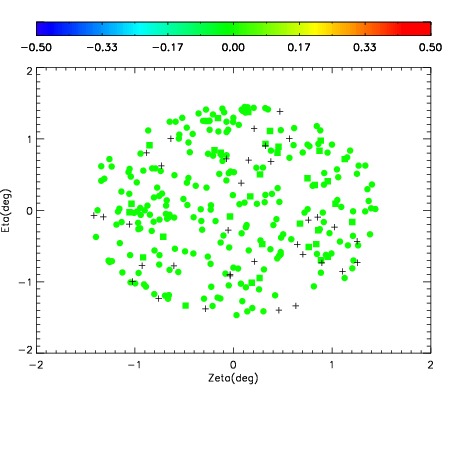
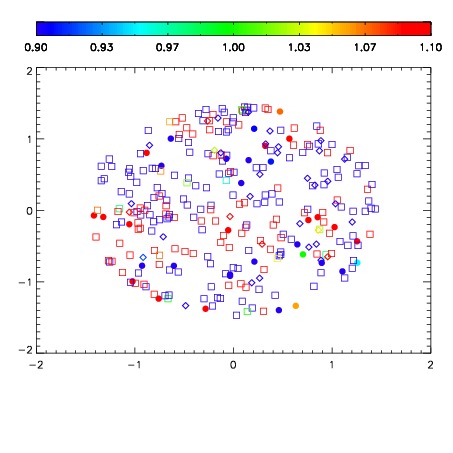
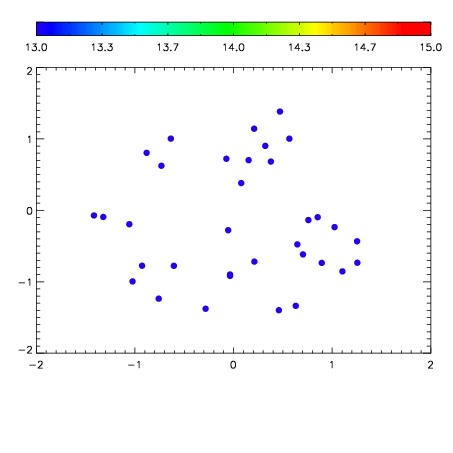

| Frame | Nreads | Zeropoints | Mag plots | Spatial mag deviation | Spatial sky 16325A emission deviations (filled: sky, open: star) | Spatial sky continuum emission | Spatial sky telluric CO2 absorption deviations (filled: H < 10) | |||||||||||||||||||||||
| 0 | 0 |
|
|
|
|
|
|
| IPAIR | NAME | SHIFT | NEWSHIFT | S/N | NAME | SHIFT | NEWSHIFT | S/N |
| 0 | 11170046 | 0.475222 | 0.00000 | 18.5889 | 11170052 | -0.00656647 | 0.481788 | 18.6234 |
| 1 | 11170047 | 0.474586 | 0.000635982 | 18.7203 | 11170048 | -0.00553157 | 0.480754 | 18.6547 |
| 2 | 11170050 | 0.473833 | 0.00138900 | 18.5597 | 11170045 | 0.00000 | 0.475222 | 18.5950 |
| 3 | 11170051 | 0.472984 | 0.00223801 | 18.5194 | 11170049 | -0.00479768 | 0.480020 | 18.4953 |