| Red | Green | Blue | |
| z | 17.64 | ||
| znorm | Inf | ||
| sky | -Inf | -Inf | -Inf |
| S/N | 23.5 | 38.9 | 42.4 |
| S/N(c) | 0.0 | 0.0 | 0.0 |
| SN(E/C) |
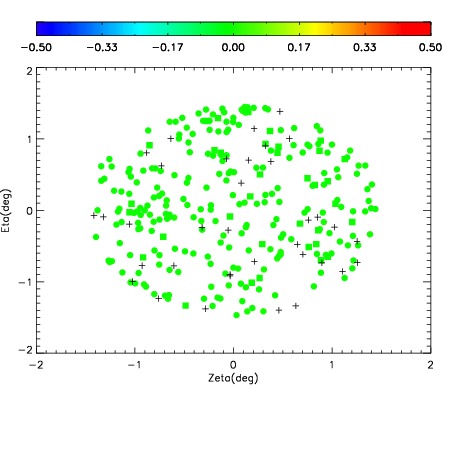
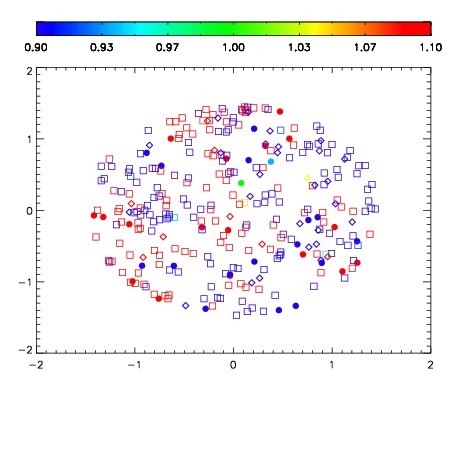
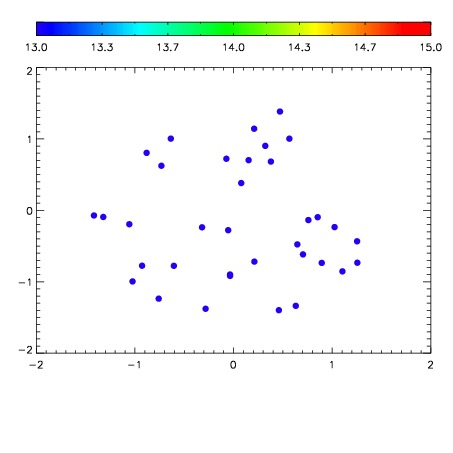

| Frame | Nreads | Zeropoints | Mag plots | Spatial mag deviation | Spatial sky 16325A emission deviations (filled: sky, open: star) | Spatial sky continuum emission | Spatial sky telluric CO2 absorption deviations (filled: H < 10) | |||||||||||||||||||||||
| 0 | 0 |
|
|
|
|
|
|
| IPAIR | NAME | SHIFT | NEWSHIFT | S/N | NAME | SHIFT | NEWSHIFT | S/N |
| 0 | 11390023 | 0.471878 | 0.00000 | 18.6909 | 11390022 | 0.00000 | 0.471878 | 18.8683 |
| 1 | 11390027 | 0.470677 | 0.00120100 | 19.0120 | 11390026 | 8.75389e-05 | 0.471790 | 18.9776 |
| 2 | 11390028 | 0.471297 | 0.000580996 | 18.9049 | 11390029 | 0.00180718 | 0.470071 | 18.9374 |
| 3 | 11390024 | 0.471826 | 5.20051e-05 | 18.6354 | 11390025 | -0.000431619 | 0.472310 | 18.8194 |