| Red | Green | Blue | |
| z | 17.64 | ||
| znorm | Inf | ||
| sky | -Inf | -NaN | -Inf |
| S/N | 21.5 | 35.4 | 36.2 |
| S/N(c) | 0.0 | 0.0 | 0.0 |
| SN(E/C) |
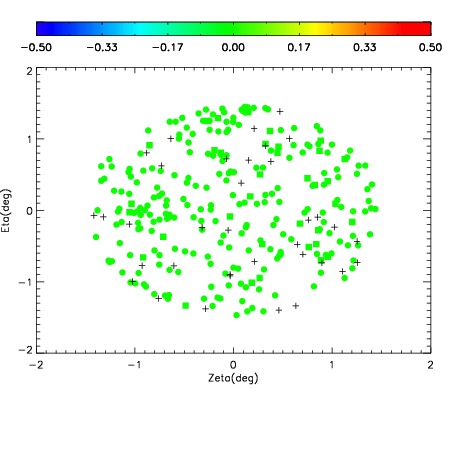
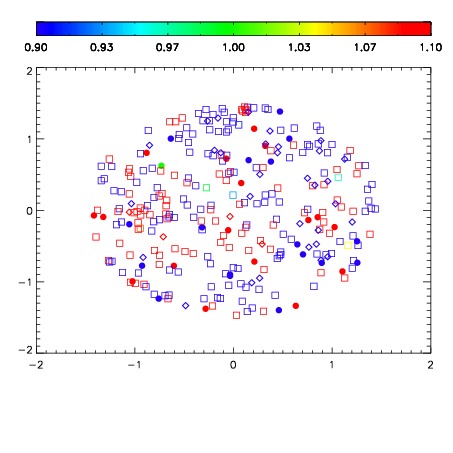
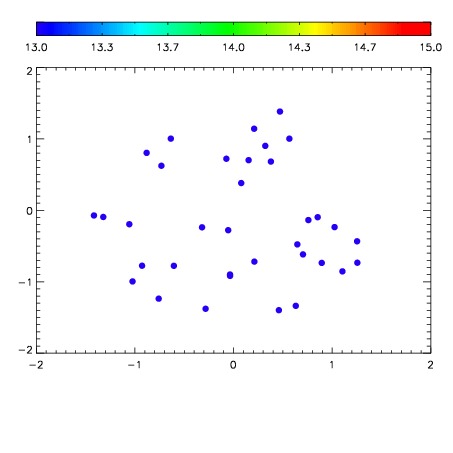

| Frame | Nreads | Zeropoints | Mag plots | Spatial mag deviation | Spatial sky 16325A emission deviations (filled: sky, open: star) | Spatial sky continuum emission | Spatial sky telluric CO2 absorption deviations (filled: H < 10) | |||||||||||||||||||||||
| 0 | 0 |
|
|
|
|
|
|
| IPAIR | NAME | SHIFT | NEWSHIFT | S/N | NAME | SHIFT | NEWSHIFT | S/N |
| 0 | 11410024 | 0.474168 | 0.00000 | 18.8148 | 11410026 | -0.00160529 | 0.475773 | 18.1885 |
| 1 | 11410023 | 0.473339 | 0.000829011 | 18.9885 | 11410022 | 0.00000 | 0.474168 | 18.6854 |
| 2 | 11410028 | 0.474061 | 0.000106990 | 18.8832 | 11410029 | -0.000963515 | 0.475132 | 18.6758 |
| 3 | 11410027 | 0.473562 | 0.000606000 | 18.7173 | 11410025 | -0.00192047 | 0.476088 | 17.7736 |