| Red | Green | Blue | |
| z | 17.64 | ||
| znorm | Inf | ||
| sky | -Inf | -Inf | -Inf |
| S/N | 26.7 | 46.5 | 48.0 |
| S/N(c) | 0.0 | 0.0 | 0.0 |
| SN(E/C) |
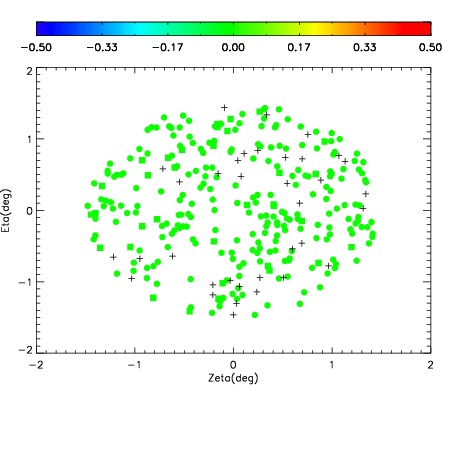
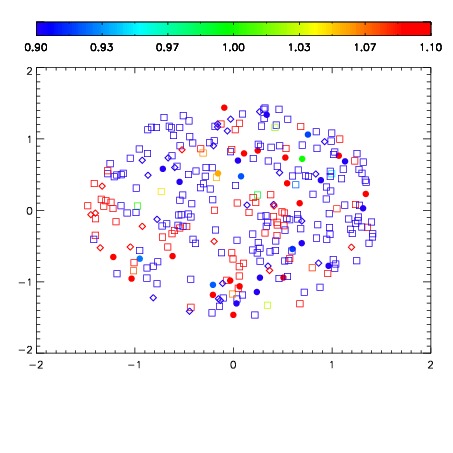
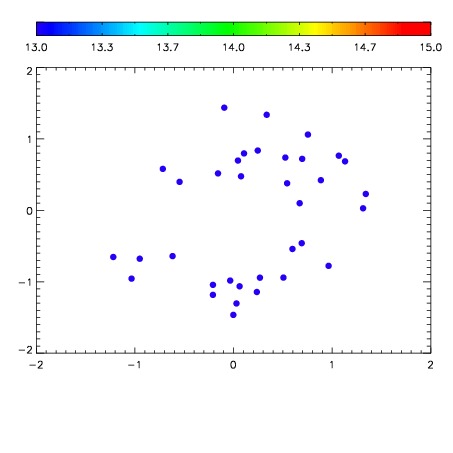

| Frame | Nreads | Zeropoints | Mag plots | Spatial mag deviation | Spatial sky 16325A emission deviations (filled: sky, open: star) | Spatial sky continuum emission | Spatial sky telluric CO2 absorption deviations (filled: H < 10) | |||||||||||||||||||||||
| 0 | 0 |
|
|
|
|
|
|
| IPAIR | NAME | SHIFT | NEWSHIFT | S/N | NAME | SHIFT | NEWSHIFT | S/N |
| 0 | 11060032 | 0.480689 | 0.00000 | 18.7688 | 11060026 | 0.00000 | 0.480689 | 18.7802 |
| 1 | 11060027 | 0.478362 | 0.00232700 | 18.7959 | 11060037 | -0.00429774 | 0.484987 | 18.8006 |
| 2 | 11060031 | 0.480655 | 3.39746e-05 | 18.6978 | 11060033 | -0.00562006 | 0.486309 | 18.7699 |
| 3 | 11060028 | 0.479920 | 0.000768989 | 18.6975 | 11060030 | -0.00100858 | 0.481698 | 18.7673 |
| 4 | 11060036 | 0.477942 | 0.00274700 | 18.6443 | 11060034 | -0.00558417 | 0.486273 | 18.7482 |
| 5 | 11060035 | 0.478046 | 0.00264299 | 18.6336 | 11060029 | -0.000771757 | 0.481461 | 18.6723 |