| Red | Green | Blue | |
| z | 17.64 | ||
| znorm | Inf | ||
| sky | -NaN | -NaN | -Inf |
| S/N | 27.8 | 47.2 | 49.5 |
| S/N(c) | 0.0 | 0.0 | 0.0 |
| SN(E/C) |
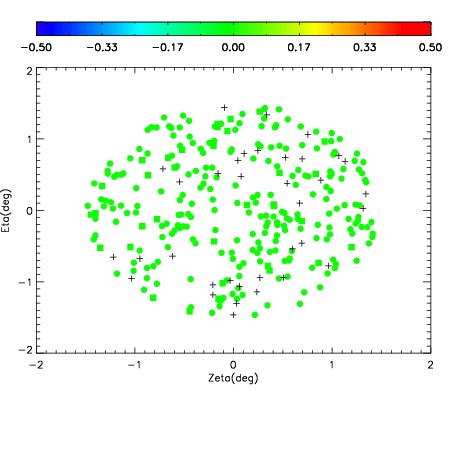
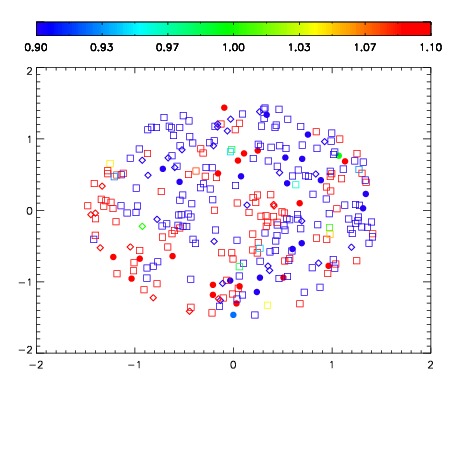
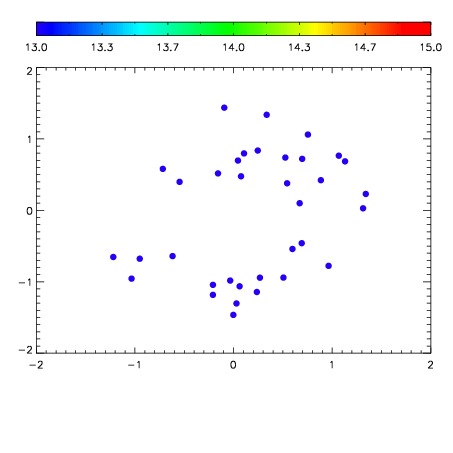

| Frame | Nreads | Zeropoints | Mag plots | Spatial mag deviation | Spatial sky 16325A emission deviations (filled: sky, open: star) | Spatial sky continuum emission | Spatial sky telluric CO2 absorption deviations (filled: H < 10) | |||||||||||||||||||||||
| 0 | 0 |
|
|
|
|
|
|
| IPAIR | NAME | SHIFT | NEWSHIFT | S/N | NAME | SHIFT | NEWSHIFT | S/N |
| 0 | 11360017 | 0.482018 | 0.00000 | 19.1108 | 11360018 | -0.000823030 | 0.482841 | 19.0918 |
| 1 | 11360016 | 0.481763 | 0.000254989 | 19.1081 | 11360015 | -0.000782766 | 0.482801 | 19.0658 |
| 2 | 11360012 | 0.481126 | 0.000891984 | 19.0317 | 11360011 | 0.00000 | 0.482018 | 19.0489 |
| 3 | 11360013 | 0.480768 | 0.00125000 | 19.0315 | 11360014 | -0.000484042 | 0.482502 | 19.0242 |