| Red | Green | Blue | |
| z | 17.64 | ||
| znorm | Inf | ||
| sky | -Inf | -Inf | -Inf |
| S/N | 24.0 | 41.2 | 43.8 |
| S/N(c) | 0.0 | 0.0 | 0.0 |
| SN(E/C) |
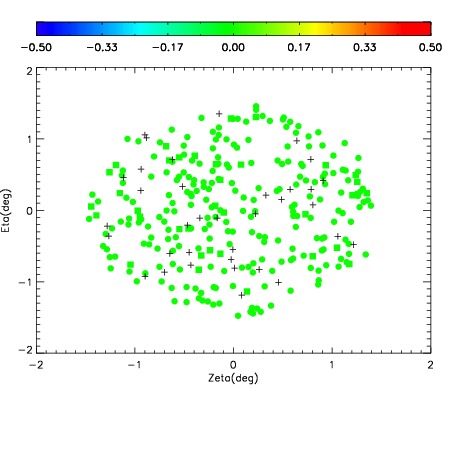
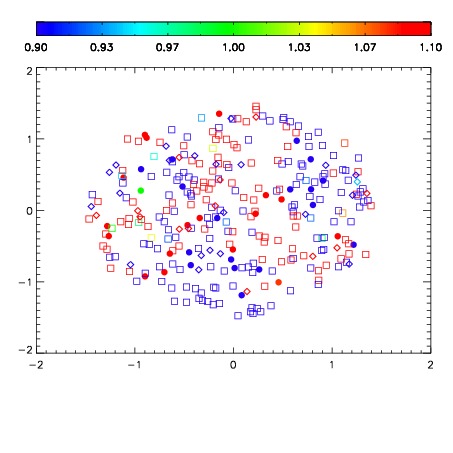
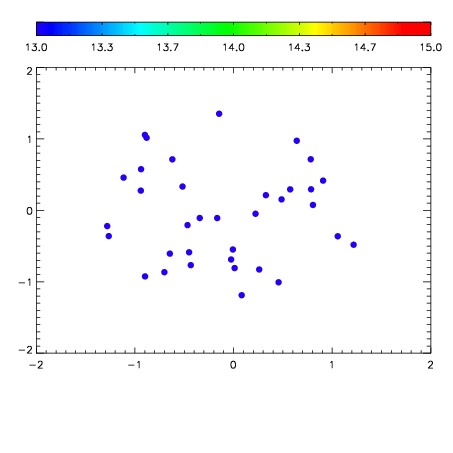

| Frame | Nreads | Zeropoints | Mag plots | Spatial mag deviation | Spatial sky 16325A emission deviations (filled: sky, open: star) | Spatial sky continuum emission | Spatial sky telluric CO2 absorption deviations (filled: H < 10) | |||||||||||||||||||||||
| 0 | 0 |
|
|
|
|
|
|
| IPAIR | NAME | SHIFT | NEWSHIFT | S/N | NAME | SHIFT | NEWSHIFT | S/N |
| 0 | 11090028 | 0.478061 | 0.00000 | 18.8715 | 11090023 | 0.00000 | 0.478061 | 18.7969 |
| 1 | 11090029 | 0.477807 | 0.000254005 | 18.8869 | 11090026 | -0.00180285 | 0.479864 | 18.9425 |
| 2 | 11090025 | 0.477928 | 0.000132978 | 18.8820 | 11090030 | -0.00290650 | 0.480967 | 18.8992 |
| 3 | 11090024 | 0.477658 | 0.000402987 | 18.7868 | 11090027 | -0.00130232 | 0.479363 | 18.7755 |