| Red | Green | Blue | |
| z | 17.64 | ||
| znorm | Inf | ||
| sky | -Inf | -Inf | -Inf |
| S/N | 28.4 | 47.6 | 51.2 |
| S/N(c) | 0.0 | 0.0 | 0.0 |
| SN(E/C) |

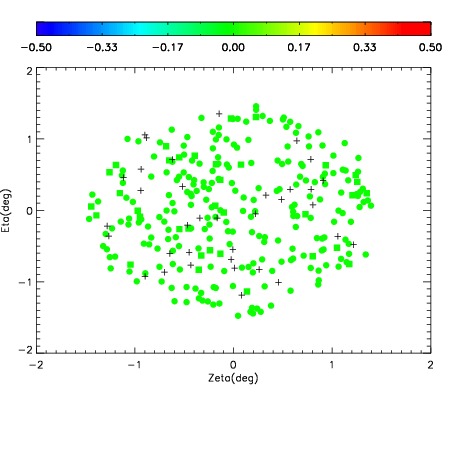
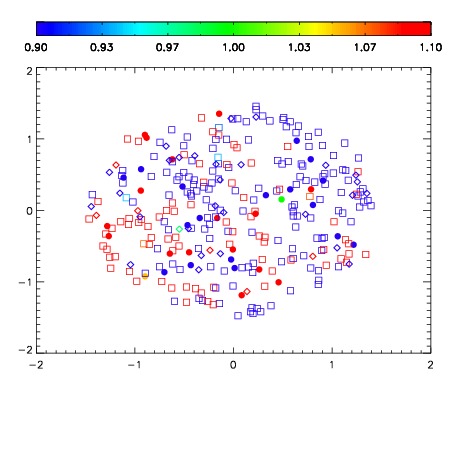
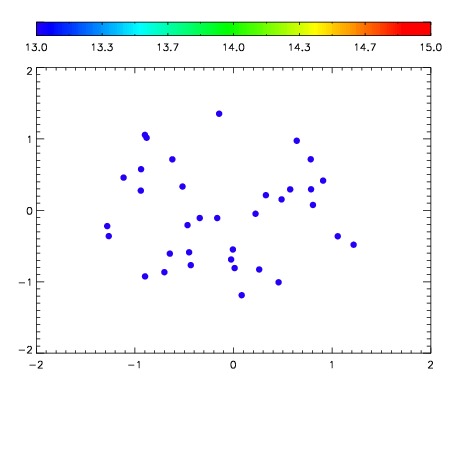

| Frame | Nreads | Zeropoints | Mag plots | Spatial mag deviation | Spatial sky 16325A emission deviations (filled: sky, open: star) | Spatial sky continuum emission | Spatial sky telluric CO2 absorption deviations (filled: H < 10) | |||||||||||||||||||||||
| 0 | 0 |
|
|
|
|
|
|
| IPAIR | NAME | SHIFT | NEWSHIFT | S/N | NAME | SHIFT | NEWSHIFT | S/N |
| 0 | 11130028 | 0.481097 | 0.00000 | 19.0922 | 11130025 | -0.00295871 | 0.484056 | 19.0935 |
| 1 | 11130027 | 0.481002 | 9.50098e-05 | 19.0925 | 11130026 | -0.00285561 | 0.483953 | 19.0961 |
| 2 | 11130024 | 0.481026 | 7.10189e-05 | 19.0922 | 11130029 | -0.00288979 | 0.483987 | 19.0726 |
| 3 | 11130023 | 0.480239 | 0.000858009 | 19.0587 | 11130022 | 0.00000 | 0.481097 | 18.9832 |