| Red | Green | Blue | |
| z | 17.64 | ||
| znorm | Inf | ||
| sky | -NaN | -Inf | -Inf |
| S/N | 22.6 | 37.7 | 42.7 |
| S/N(c) | 0.0 | 0.0 | 0.0 |
| SN(E/C) |
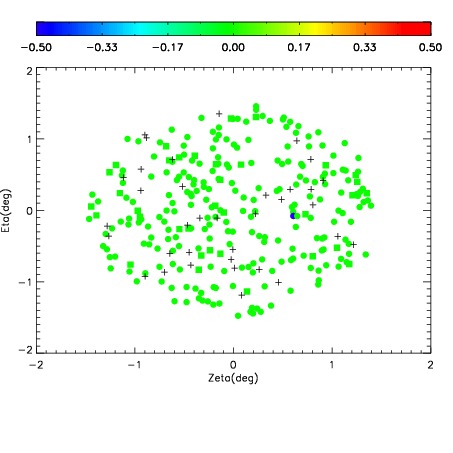

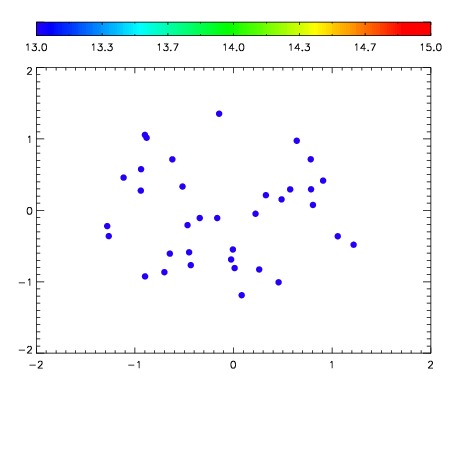

| Frame | Nreads | Zeropoints | Mag plots | Spatial mag deviation | Spatial sky 16325A emission deviations (filled: sky, open: star) | Spatial sky continuum emission | Spatial sky telluric CO2 absorption deviations (filled: H < 10) | |||||||||||||||||||||||
| 0 | 0 |
|
|
|
|
|
|
| IPAIR | NAME | SHIFT | NEWSHIFT | S/N | NAME | SHIFT | NEWSHIFT | S/N |
| 0 | 11420012 | 0.479097 | 0.00000 | 19.0726 | 11420011 | 0.00000 | 0.479097 | 19.0439 |
| 1 | 11420013 | 0.479070 | 2.70009e-05 | 19.0128 | 11420014 | -0.00103494 | 0.480132 | 18.8811 |
| 2 | 11420017 | 0.478603 | 0.000494003 | 18.5826 | 11420015 | -0.000634383 | 0.479731 | 18.6992 |
| 3 | 11420016 | 0.478412 | 0.000685006 | 18.5489 | 11420018 | -0.00111559 | 0.480213 | 18.4175 |