| Red | Green | Blue | |
| z | 17.64 | ||
| znorm | Inf | ||
| sky | -Inf | -Inf | -Inf |
| S/N | 28.7 | 48.8 | 51.3 |
| S/N(c) | 0.0 | 0.0 | 0.0 |
| SN(E/C) |
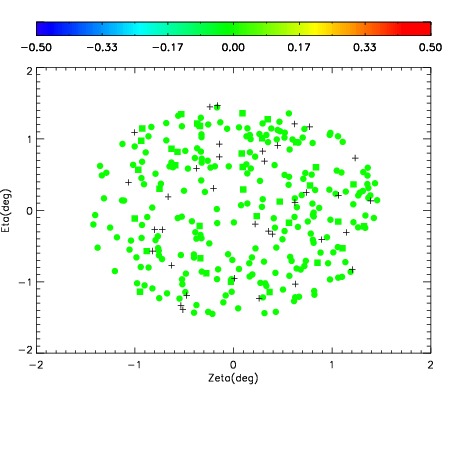
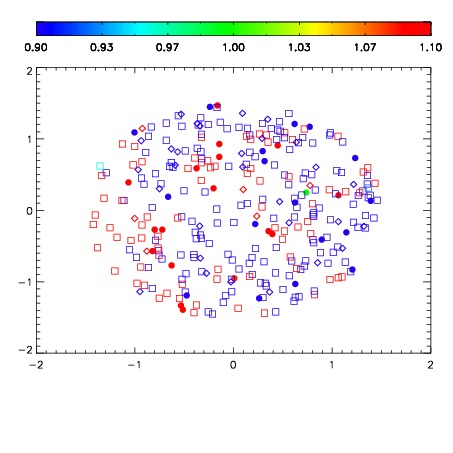


| Frame | Nreads | Zeropoints | Mag plots | Spatial mag deviation | Spatial sky 16325A emission deviations (filled: sky, open: star) | Spatial sky continuum emission | Spatial sky telluric CO2 absorption deviations (filled: H < 10) | |||||||||||||||||||||||
| 0 | 0 |
|
|
|
|
|
|
| IPAIR | NAME | SHIFT | NEWSHIFT | S/N | NAME | SHIFT | NEWSHIFT | S/N |
| 0 | 10820047 | 0.483939 | 0.00000 | 19.1604 | 10820050 | -0.000171049 | 0.484110 | 19.1655 |
| 1 | 10820048 | 0.483362 | 0.000577003 | 19.1928 | 10820049 | -0.000180087 | 0.484119 | 19.1762 |
| 2 | 10820051 | 0.483263 | 0.000676006 | 19.1113 | 10820053 | 0.00183920 | 0.482100 | 19.1132 |
| 3 | 10820052 | 0.483610 | 0.000328988 | 19.0766 | 10820046 | 0.00000 | 0.483939 | 19.0802 |