| Red | Green | Blue | |
| z | 17.64 | ||
| znorm | Inf | ||
| sky | -Inf | -Inf | -Inf |
| S/N | 30.3 | 49.8 | 53.6 |
| S/N(c) | 0.0 | 0.0 | 0.0 |
| SN(E/C) |
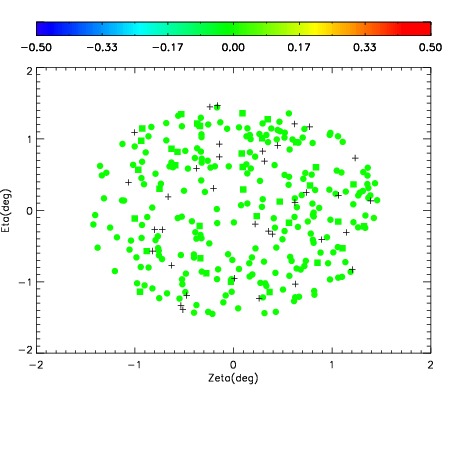
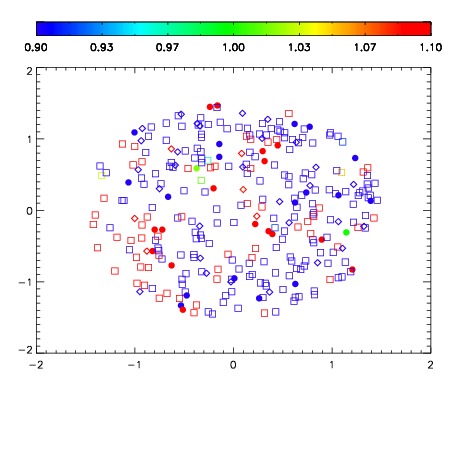
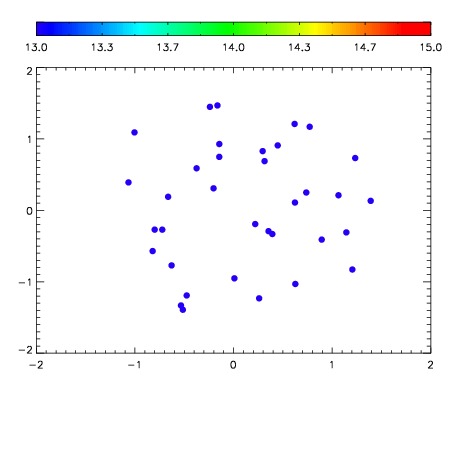

| Frame | Nreads | Zeropoints | Mag plots | Spatial mag deviation | Spatial sky 16325A emission deviations (filled: sky, open: star) | Spatial sky continuum emission | Spatial sky telluric CO2 absorption deviations (filled: H < 10) | |||||||||||||||||||||||
| 0 | 0 |
|
|
|
|
|
|
| IPAIR | NAME | SHIFT | NEWSHIFT | S/N | NAME | SHIFT | NEWSHIFT | S/N |
| 0 | 10880049 | 0.497738 | 0.00000 | 19.1400 | 10880051 | -0.00385032 | 0.501588 | 19.1274 |
| 1 | 10880053 | 0.496986 | 0.000752002 | 19.1773 | 10880050 | -0.00369651 | 0.501435 | 19.1758 |
| 2 | 10880052 | 0.496861 | 0.000876993 | 19.1474 | 10880054 | 0.0993671 | 0.398371 | 19.1722 |
| 3 | 10880048 | 0.496325 | 0.00141302 | 19.1328 | 10880047 | 0.00000 | 0.497738 | 19.0804 |