| Red | Green | Blue | |
| z | 17.64 | ||
| znorm | Inf | ||
| sky | -Inf | -Inf | -Inf |
| S/N | 26.6 | 45.0 | 48.5 |
| S/N(c) | 0.0 | 0.0 | 0.0 |
| SN(E/C) |
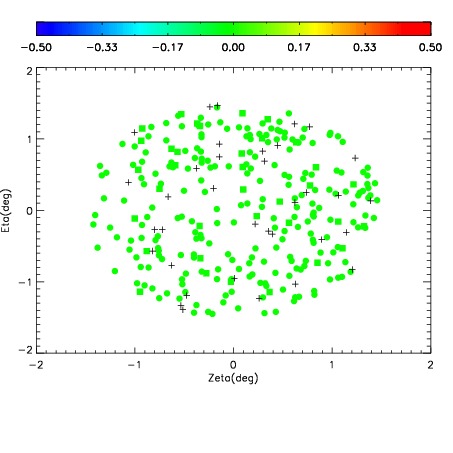
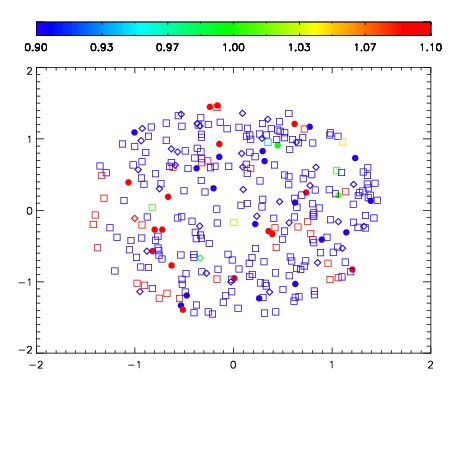
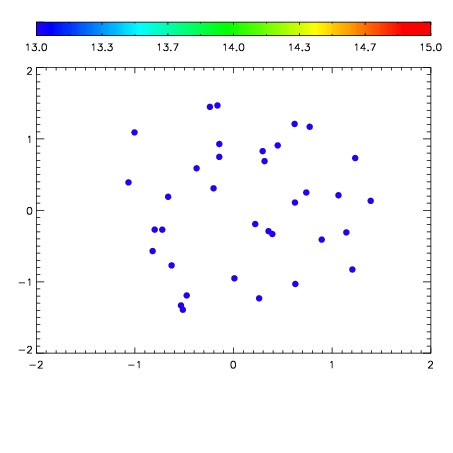

| Frame | Nreads | Zeropoints | Mag plots | Spatial mag deviation | Spatial sky 16325A emission deviations (filled: sky, open: star) | Spatial sky continuum emission | Spatial sky telluric CO2 absorption deviations (filled: H < 10) | |||||||||||||||||||||||
| 0 | 0 |
|
|
|
|
|
|
| IPAIR | NAME | SHIFT | NEWSHIFT | S/N | NAME | SHIFT | NEWSHIFT | S/N |
| 0 | 11110034 | 0.474092 | 0.00000 | 18.9927 | 11110036 | -0.00635534 | 0.480447 | 18.9199 |
| 1 | 11110039 | 0.471928 | 0.00216401 | 19.0423 | 11110040 | -0.00613799 | 0.480230 | 19.0467 |
| 2 | 11110038 | 0.472028 | 0.00206402 | 19.0299 | 11110033 | 0.00000 | 0.474092 | 18.9425 |
| 3 | 11110035 | 0.473785 | 0.000306994 | 18.9870 | 11110037 | -0.00614938 | 0.480241 | 18.8659 |