| Red | Green | Blue | |
| z | 17.64 | ||
| znorm | Inf | ||
| sky | -NaN | -NaN | -Inf |
| S/N | 26.4 | 44.2 | 47.3 |
| S/N(c) | 0.0 | 0.0 | 0.0 |
| SN(E/C) |
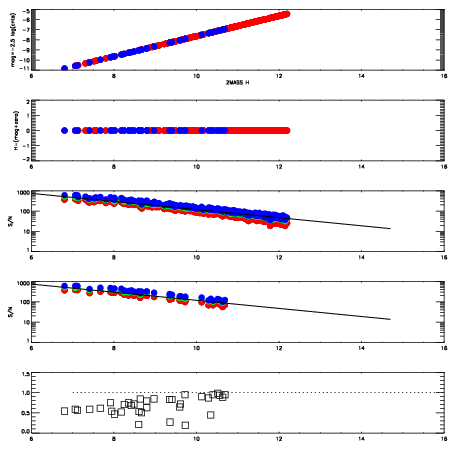
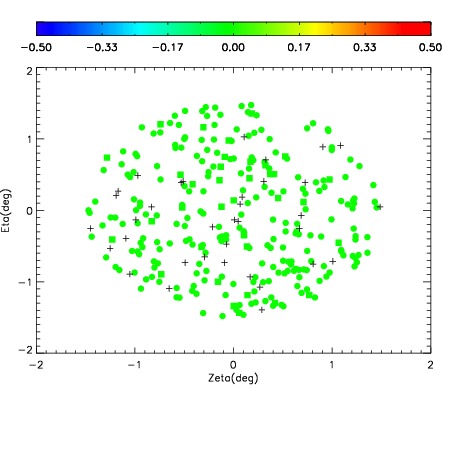
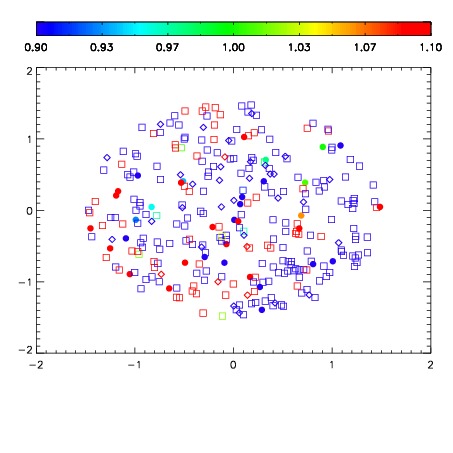


| Frame | Nreads | Zeropoints | Mag plots | Spatial mag deviation | Spatial sky 16325A emission deviations (filled: sky, open: star) | Spatial sky continuum emission | Spatial sky telluric CO2 absorption deviations (filled: H < 10) | |||||||||||||||||||||||
| 0 | 0 |
|
|
|
|
|
|
| IPAIR | NAME | SHIFT | NEWSHIFT | S/N | NAME | SHIFT | NEWSHIFT | S/N |
| 0 | 10270070 | 0.499333 | 0.00000 | 18.9675 | 10270072 | 0.00253490 | 0.496798 | 19.0299 |
| 1 | 10270069 | 0.499142 | 0.000191003 | 19.0099 | 10270075 | 0.00222119 | 0.497112 | 19.0604 |
| 2 | 10270073 | 0.496449 | 0.00288400 | 19.0051 | 10270071 | 0.00252658 | 0.496806 | 19.0522 |
| 3 | 10270074 | 0.496503 | 0.00283000 | 18.9770 | 10270068 | 0.00000 | 0.499333 | 19.0348 |