| Red | Green | Blue | |
| z | 17.64 | ||
| znorm | Inf | ||
| sky | -Inf | -Inf | -NaN |
| S/N | 31.8 | 52.6 | 54.2 |
| S/N(c) | 0.0 | 0.0 | 0.0 |
| SN(E/C) |
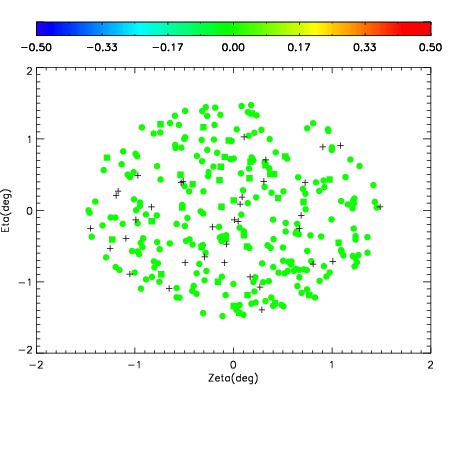
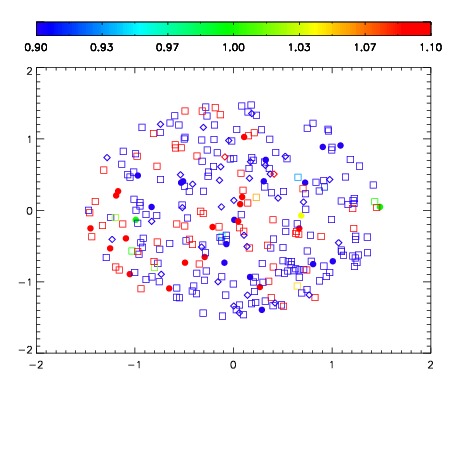
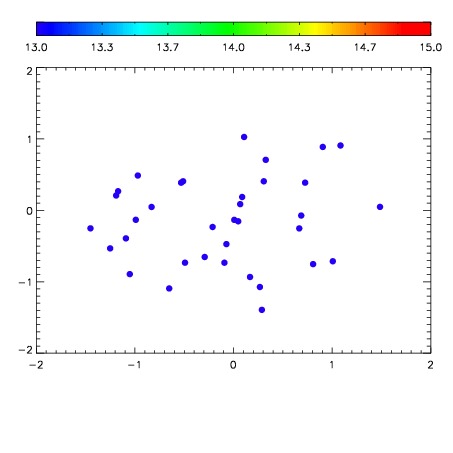

| Frame | Nreads | Zeropoints | Mag plots | Spatial mag deviation | Spatial sky 16325A emission deviations (filled: sky, open: star) | Spatial sky continuum emission | Spatial sky telluric CO2 absorption deviations (filled: H < 10) | |||||||||||||||||||||||
| 0 | 0 |
|
|
|
|
|
|
| IPAIR | NAME | SHIFT | NEWSHIFT | S/N | NAME | SHIFT | NEWSHIFT | S/N |
| 0 | 10310037 | 0.507421 | 0.00000 | 19.1689 | 10310035 | 0.00394458 | 0.503476 | 19.1430 |
| 1 | 10310036 | 0.507047 | 0.000374019 | 19.1497 | 10310034 | 0.00345491 | 0.503966 | 19.1218 |
| 2 | 10310032 | 0.504976 | 0.00244504 | 19.1411 | 10310039 | 0.00129517 | 0.506126 | 19.1175 |
| 3 | 10310040 | 0.506378 | 0.00104302 | 19.1241 | 10310038 | 0.000421057 | 0.507000 | 19.0937 |
| 4 | 10310033 | 0.506037 | 0.00138402 | 19.0843 | 10310031 | 0.00000 | 0.507421 | 19.0816 |