| Red | Green | Blue | |
| z | 17.64 | ||
| znorm | Inf | ||
| sky | -Inf | -Inf | -Inf |
| S/N | 16.7 | 27.3 | 29.1 |
| S/N(c) | 0.0 | 0.0 | 0.0 |
| SN(E/C) |
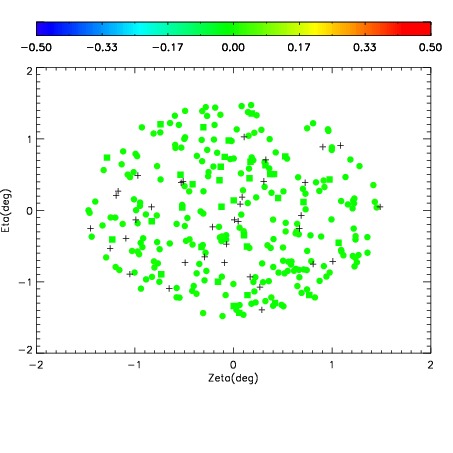
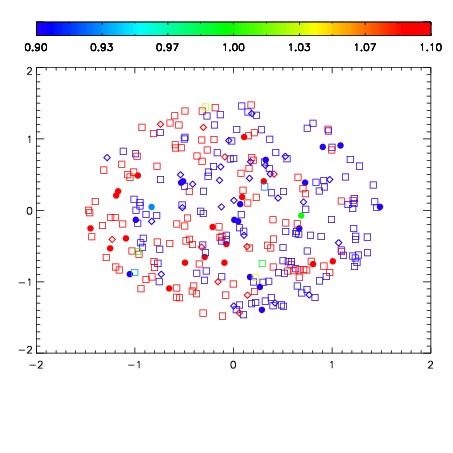


| Frame | Nreads | Zeropoints | Mag plots | Spatial mag deviation | Spatial sky 16325A emission deviations (filled: sky, open: star) | Spatial sky continuum emission | Spatial sky telluric CO2 absorption deviations (filled: H < 10) | |||||||||||||||||||||||
| 0 | 0 |
|
|
|
|
|
|
| IPAIR | NAME | SHIFT | NEWSHIFT | S/N | NAME | SHIFT | NEWSHIFT | S/N |
| 0 | 10530051 | 0.510270 | 0.00000 | 18.4564 | 10530049 | 0.00390012 | 0.506370 | 18.0919 |
| 1 | 10530046 | 0.505150 | 0.00511998 | 19.0113 | 10530045 | 0.00000 | 0.510270 | 18.9174 |
| 2 | 10530047 | 0.506945 | 0.00332499 | 18.7211 | 10530052 | 0.0281537 | 0.482116 | 18.7041 |
| 3 | 10530050 | 0.510252 | 1.80006e-05 | 17.5999 | 10530048 | 0.00356052 | 0.506709 | 17.1183 |