| Red | Green | Blue | |
| z | 17.64 | ||
| znorm | Inf | ||
| sky | -Inf | -Inf | -NaN |
| S/N | 25.9 | 45.6 | 48.1 |
| S/N(c) | 0.0 | 0.0 | 0.0 |
| SN(E/C) |
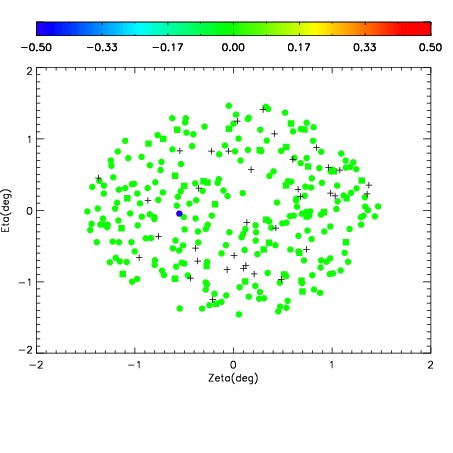
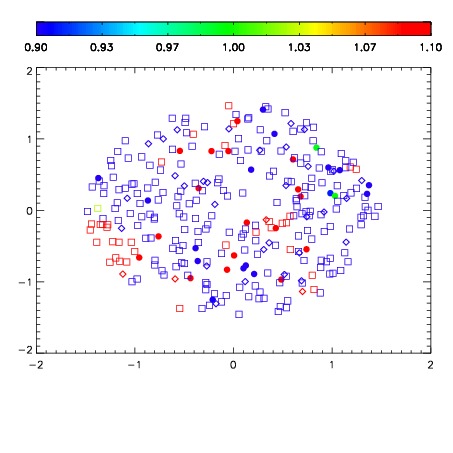
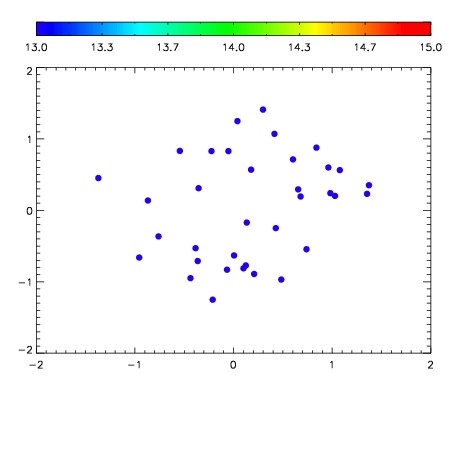

| Frame | Nreads | Zeropoints | Mag plots | Spatial mag deviation | Spatial sky 16325A emission deviations (filled: sky, open: star) | Spatial sky continuum emission | Spatial sky telluric CO2 absorption deviations (filled: H < 10) | |||||||||||||||||||||||
| 0 | 0 |
|
|
|
|
|
|
| IPAIR | NAME | SHIFT | NEWSHIFT | S/N | NAME | SHIFT | NEWSHIFT | S/N |
| 0 | 11130061 | 0.476492 | 0.00000 | 19.0344 | 11130055 | 0.00000 | 0.476492 | 19.0528 |
| 1 | 11130060 | 0.475828 | 0.000663996 | 19.0951 | 11130059 | -0.00401455 | 0.480507 | 19.0883 |
| 2 | 11130056 | 0.474965 | 0.00152698 | 19.0709 | 11130058 | -0.00458511 | 0.481077 | 19.0585 |
| 3 | 11130057 | 0.474783 | 0.00170898 | 19.0498 | 11130062 | -0.00551741 | 0.482009 | 19.0552 |