| Red | Green | Blue | |
| z | 17.64 | ||
| znorm | Inf | ||
| sky | -Inf | -Inf | -Inf |
| S/N | 22.4 | 39.5 | 41.5 |
| S/N(c) | 0.0 | 0.0 | 0.0 |
| SN(E/C) |
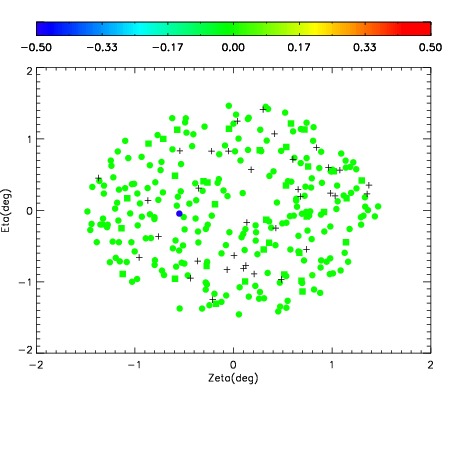
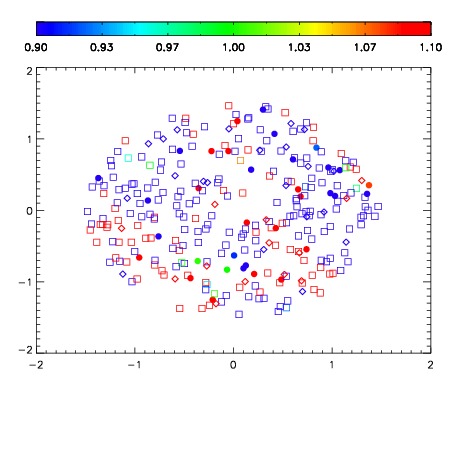
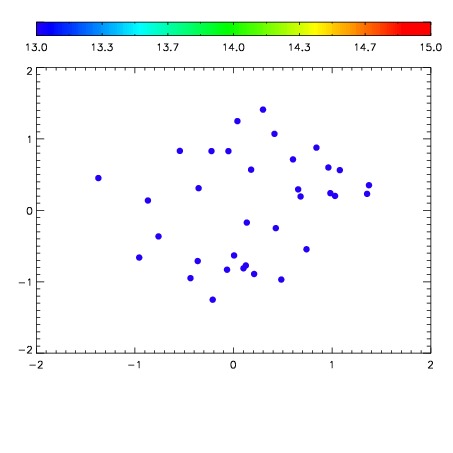

| Frame | Nreads | Zeropoints | Mag plots | Spatial mag deviation | Spatial sky 16325A emission deviations (filled: sky, open: star) | Spatial sky continuum emission | Spatial sky telluric CO2 absorption deviations (filled: H < 10) | |||||||||||||||||||||||
| 0 | 0 |
|
|
|
|
|
|
| IPAIR | NAME | SHIFT | NEWSHIFT | S/N | NAME | SHIFT | NEWSHIFT | S/N |
| 0 | 11360043 | 0.481229 | 0.00000 | 18.7894 | 11360044 | -0.00219613 | 0.483425 | 18.5343 |
| 1 | 11360038 | 0.478406 | 0.00282300 | 18.9916 | 11360037 | 0.00000 | 0.481229 | 19.0054 |
| 2 | 11360042 | 0.480264 | 0.000964999 | 18.9344 | 11360040 | -0.00231401 | 0.483543 | 18.9016 |
| 3 | 11360039 | 0.479201 | 0.00202802 | 18.8466 | 11360041 | -0.00273718 | 0.483966 | 18.8669 |