| Red | Green | Blue | |
| z | 17.64 | ||
| znorm | Inf | ||
| sky | -Inf | -Inf | -Inf |
| S/N | 21.1 | 39.5 | 41.5 |
| S/N(c) | 0.0 | 0.0 | 0.0 |
| SN(E/C) |
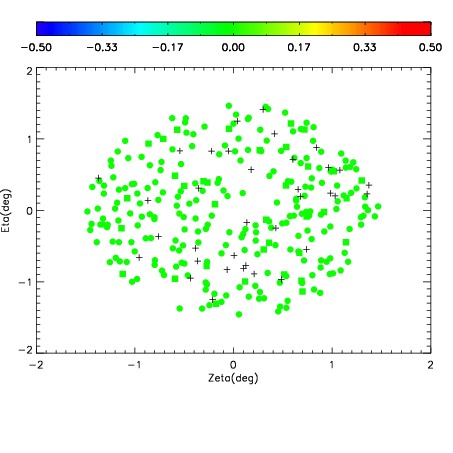
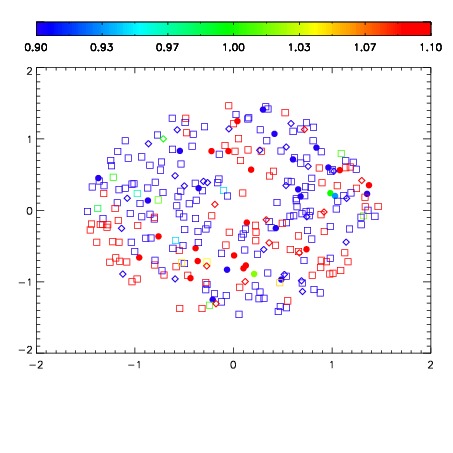
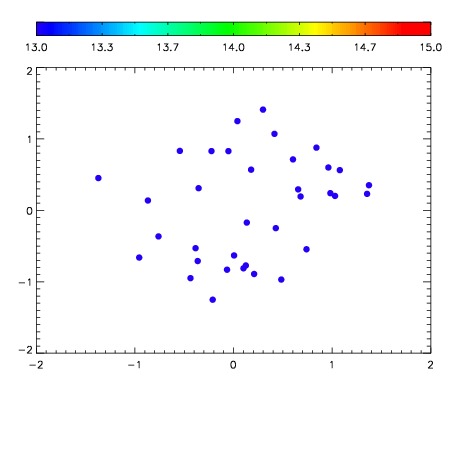

| Frame | Nreads | Zeropoints | Mag plots | Spatial mag deviation | Spatial sky 16325A emission deviations (filled: sky, open: star) | Spatial sky continuum emission | Spatial sky telluric CO2 absorption deviations (filled: H < 10) | |||||||||||||||||||||||
| 0 | 0 |
|
|
|
|
|
|
| IPAIR | NAME | SHIFT | NEWSHIFT | S/N | NAME | SHIFT | NEWSHIFT | S/N |
| 0 | 11400032 | 0.473344 | 0.00000 | 18.6396 | 11400030 | -0.00171274 | 0.475057 | 18.6474 |
| 1 | 11400031 | 0.472313 | 0.00103101 | 18.7361 | 11400026 | 0.00000 | 0.473344 | 18.7358 |
| 2 | 11400027 | 0.472019 | 0.00132501 | 18.7267 | 11400029 | -0.00146715 | 0.474811 | 18.7072 |
| 3 | 11400028 | 0.472847 | 0.000496984 | 18.6757 | 11400033 | -0.00153592 | 0.474880 | 18.6879 |