| Red | Green | Blue | |
| z | 17.64 | ||
| znorm | Inf | ||
| sky | -Inf | -Inf | -Inf |
| S/N | 29.0 | 51.8 | 54.5 |
| S/N(c) | 0.0 | 0.0 | 0.0 |
| SN(E/C) |
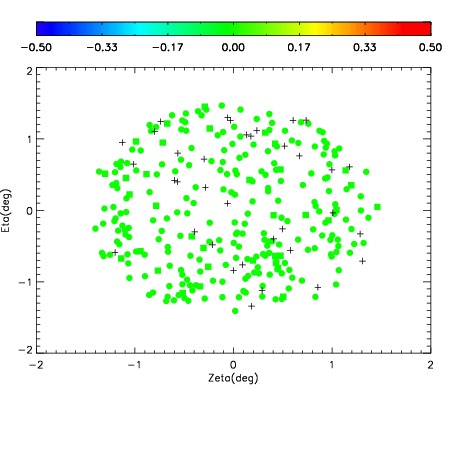

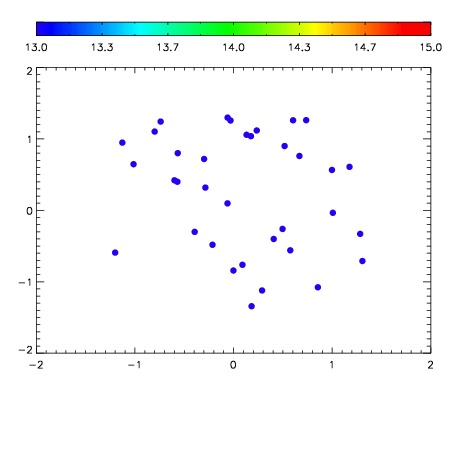

| Frame | Nreads | Zeropoints | Mag plots | Spatial mag deviation | Spatial sky 16325A emission deviations (filled: sky, open: star) | Spatial sky continuum emission | Spatial sky telluric CO2 absorption deviations (filled: H < 10) | |||||||||||||||||||||||
| 0 | 0 |
|
|
|
|
|
|
| IPAIR | NAME | SHIFT | NEWSHIFT | S/N | NAME | SHIFT | NEWSHIFT | S/N |
| 0 | 11070069 | 0.477519 | 0.00000 | 18.9222 | 11070062 | -0.00155793 | 0.479077 | 18.9256 |
| 1 | 11070064 | 0.476013 | 0.00150600 | 18.9252 | 11070070 | -0.00328012 | 0.480799 | 18.9258 |
| 2 | 11070068 | 0.477036 | 0.000483006 | 18.8823 | 11070063 | -0.000616134 | 0.478135 | 18.9205 |
| 3 | 11070060 | 0.474553 | 0.00296602 | 18.8765 | 11070066 | -0.00226638 | 0.479785 | 18.8605 |
| 4 | 11070061 | 0.474076 | 0.00344300 | 18.8584 | 11070059 | 0.00000 | 0.477519 | 18.8552 |
| 5 | 11070065 | 0.477404 | 0.000115007 | 18.6178 | 11070067 | -0.00196167 | 0.479481 | 18.8273 |