| Red | Green | Blue | |
| z | 17.64 | ||
| znorm | Inf | ||
| sky | -Inf | -Inf | -Inf |
| S/N | 22.6 | 39.3 | 41.3 |
| S/N(c) | 0.0 | 0.0 | 0.0 |
| SN(E/C) |
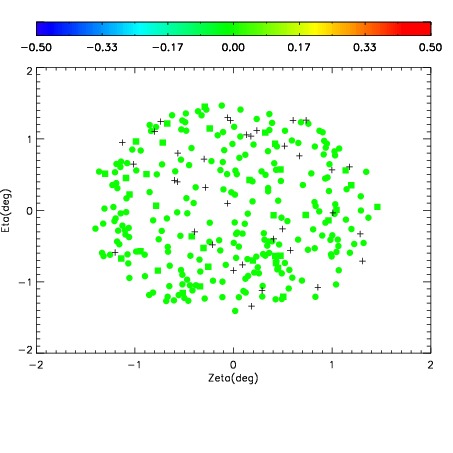
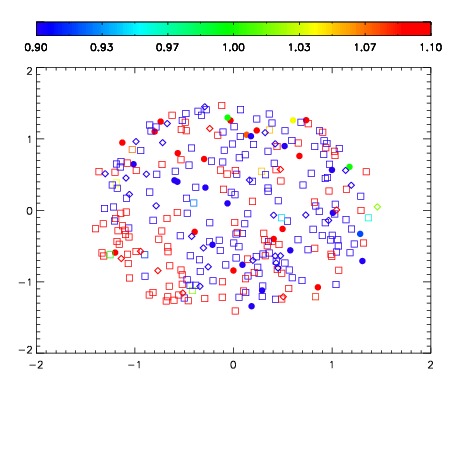
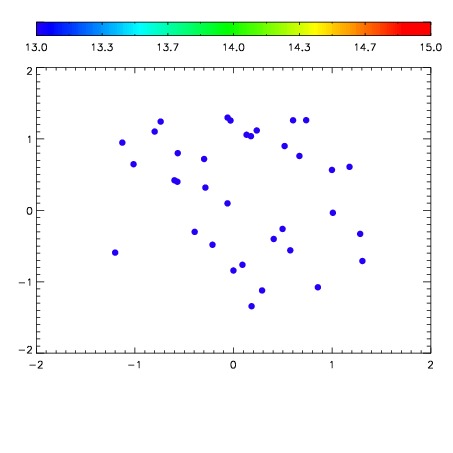

| Frame | Nreads | Zeropoints | Mag plots | Spatial mag deviation | Spatial sky 16325A emission deviations (filled: sky, open: star) | Spatial sky continuum emission | Spatial sky telluric CO2 absorption deviations (filled: H < 10) | |||||||||||||||||||||||
| 0 | 0 |
|
|
|
|
|
|
| IPAIR | NAME | SHIFT | NEWSHIFT | S/N | NAME | SHIFT | NEWSHIFT | S/N |
| 0 | 11400042 | 0.473794 | 0.00000 | 18.6945 | 11400041 | -0.00139230 | 0.475186 | 18.7332 |
| 1 | 11400038 | 0.472357 | 0.00143701 | 18.8064 | 11400044 | -0.00170126 | 0.475495 | 18.7546 |
| 2 | 11400039 | 0.472929 | 0.000865012 | 18.7537 | 11400040 | -0.00217553 | 0.475970 | 18.7500 |
| 3 | 11400043 | 0.472947 | 0.000847012 | 18.7534 | 11400037 | 0.00000 | 0.473794 | 18.7360 |