| Red | Green | Blue | |
| z | 17.64 | ||
| znorm | Inf | ||
| sky | -Inf | -Inf | -Inf |
| S/N | 21.2 | 37.2 | 40.4 |
| S/N(c) | 0.0 | 0.0 | 0.0 |
| SN(E/C) |
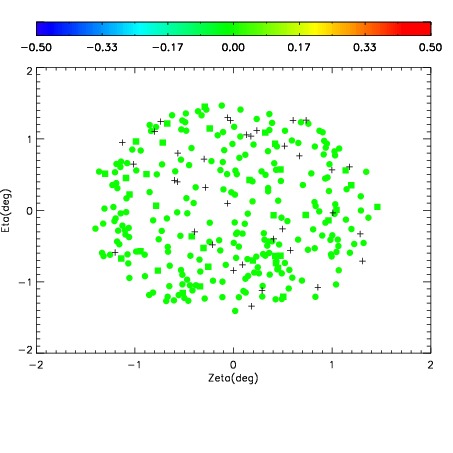
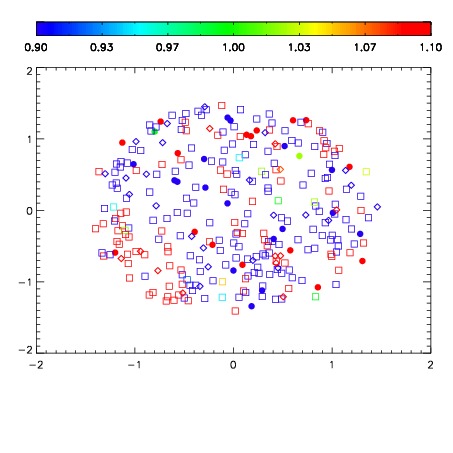
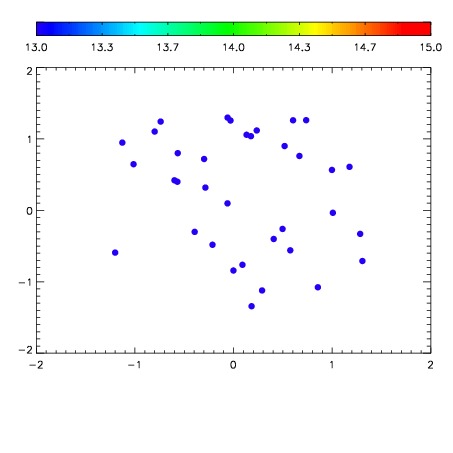

| Frame | Nreads | Zeropoints | Mag plots | Spatial mag deviation | Spatial sky 16325A emission deviations (filled: sky, open: star) | Spatial sky continuum emission | Spatial sky telluric CO2 absorption deviations (filled: H < 10) | |||||||||||||||||||||||
| 0 | 0 |
|
|
|
|
|
|
| IPAIR | NAME | SHIFT | NEWSHIFT | S/N | NAME | SHIFT | NEWSHIFT | S/N |
| 0 | 11410050 | 0.478114 | 0.00000 | 19.0095 | 11410051 | -0.00114031 | 0.479254 | 18.9432 |
| 1 | 11410049 | 0.477689 | 0.000425011 | 18.8251 | 11410048 | -0.00548069 | 0.483595 | 18.8180 |
| 2 | 11410046 | 0.476625 | 0.00148901 | 18.4690 | 11410047 | -0.00641420 | 0.484528 | 18.5786 |
| 3 | 11410045 | 0.476622 | 0.00149202 | 18.4302 | 11410044 | 0.00000 | 0.478114 | 18.5179 |