| Red | Green | Blue | |
| z | 17.64 | ||
| znorm | Inf | ||
| sky | -Inf | -Inf | -Inf |
| S/N | 15.7 | 28.3 | 29.9 |
| S/N(c) | 0.0 | 0.0 | 0.0 |
| SN(E/C) |
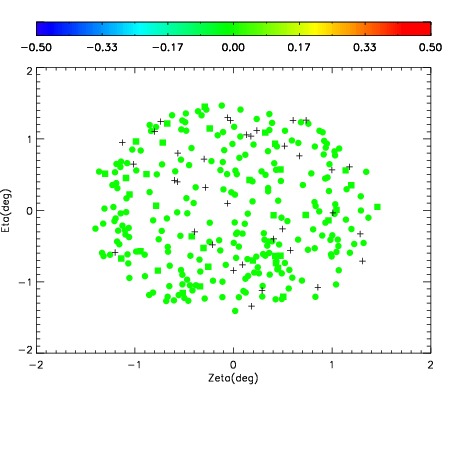
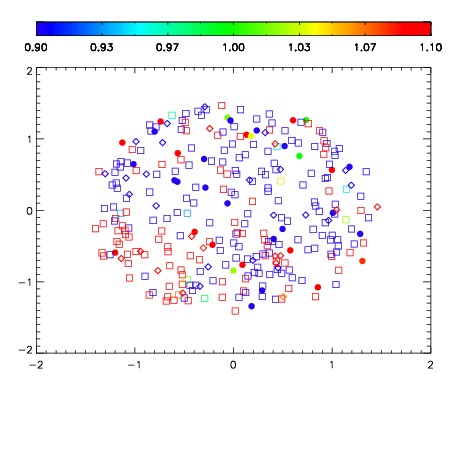
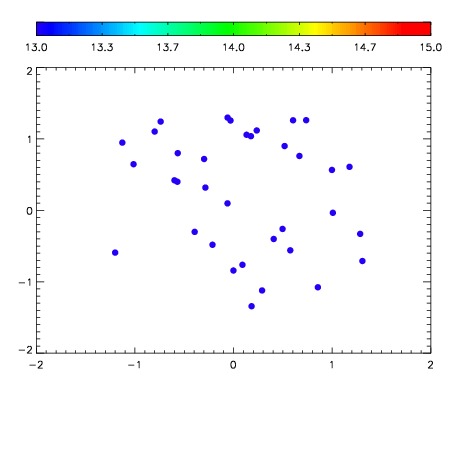

| Frame | Nreads | Zeropoints | Mag plots | Spatial mag deviation | Spatial sky 16325A emission deviations (filled: sky, open: star) | Spatial sky continuum emission | Spatial sky telluric CO2 absorption deviations (filled: H < 10) | |||||||||||||||||||||||
| 0 | 0 |
|
|
|
|
|
|
| IPAIR | NAME | SHIFT | NEWSHIFT | S/N | NAME | SHIFT | NEWSHIFT | S/N |
| 0 | 11420041 | 0.476671 | 0.00000 | 18.2892 | 11420039 | -0.00238623 | 0.479057 | 17.8126 |
| 1 | 11420036 | 0.474422 | 0.00224900 | 18.8808 | 11420035 | 0.00000 | 0.476671 | 18.6446 |
| 2 | 11420037 | 0.475191 | 0.00148001 | 18.6952 | 11420038 | -0.00293118 | 0.479602 | 18.1469 |
| 3 | 11420040 | 0.476270 | 0.000401020 | 17.9671 | 11420042 | -0.00262709 | 0.479298 | 17.6206 |