| Red | Green | Blue | |
| z | 17.64 | ||
| znorm | Inf | ||
| sky | -Inf | -Inf | -Inf |
| S/N | 25.6 | 46.1 | 48.7 |
| S/N(c) | 0.0 | 0.0 | 0.0 |
| SN(E/C) |
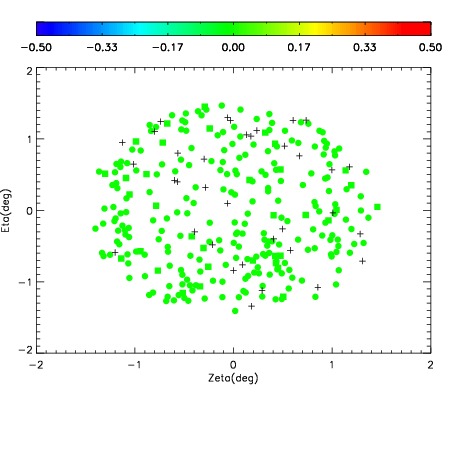
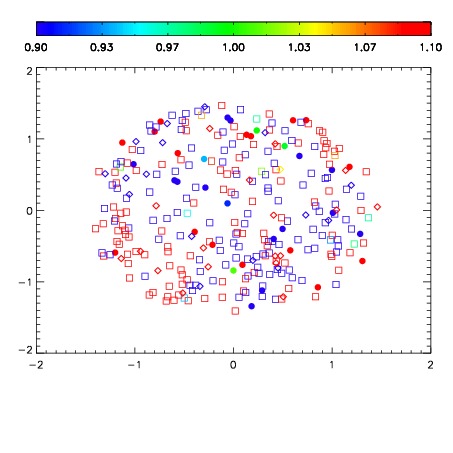
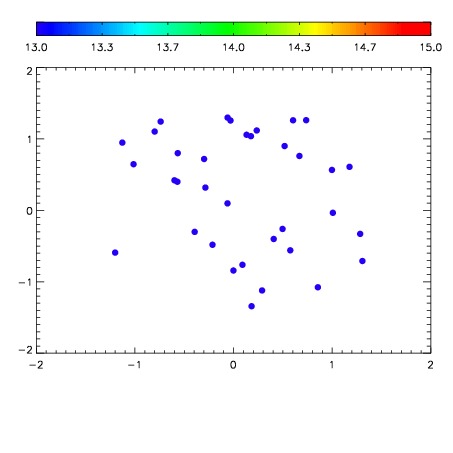

| Frame | Nreads | Zeropoints | Mag plots | Spatial mag deviation | Spatial sky 16325A emission deviations (filled: sky, open: star) | Spatial sky continuum emission | Spatial sky telluric CO2 absorption deviations (filled: H < 10) | |||||||||||||||||||||||
| 0 | 0 |
|
|
|
|
|
|
| IPAIR | NAME | SHIFT | NEWSHIFT | S/N | NAME | SHIFT | NEWSHIFT | S/N |
| 0 | 11430015 | 0.478416 | 0.00000 | 18.8103 | 11430016 | -0.00343861 | 0.481855 | 18.7569 |
| 1 | 11430014 | 0.478249 | 0.000166982 | 18.8028 | 11430024 | -0.00540377 | 0.483820 | 18.6842 |
| 2 | 11430018 | 0.478339 | 7.70092e-05 | 18.7856 | 11430021 | -0.00458572 | 0.483002 | 18.6305 |
| 3 | 11430023 | 0.477756 | 0.000660002 | 18.7353 | 11430017 | -0.00261442 | 0.481030 | 18.5846 |
| 4 | 11430022 | 0.476834 | 0.00158200 | 18.6793 | 11430020 | -0.00485922 | 0.483275 | 18.4396 |
| 5 | 11430019 | 0.477873 | 0.000542998 | 18.6361 | 11430013 | 0.00000 | 0.478416 | 18.3790 |