| Red | Green | Blue | |
| z | 17.64 | ||
| znorm | Inf | ||
| sky | -NaN | -Inf | -NaN |
| S/N | 24.4 | 43.9 | 46.7 |
| S/N(c) | 0.0 | 0.0 | 0.0 |
| SN(E/C) |
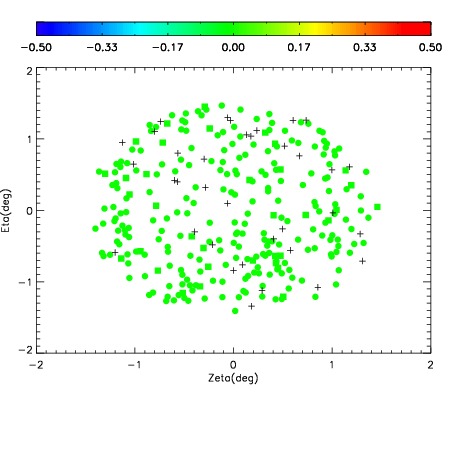
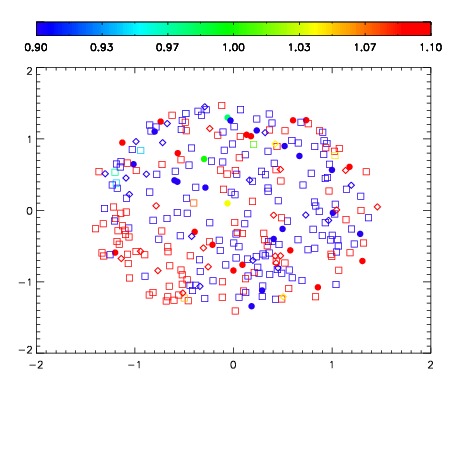
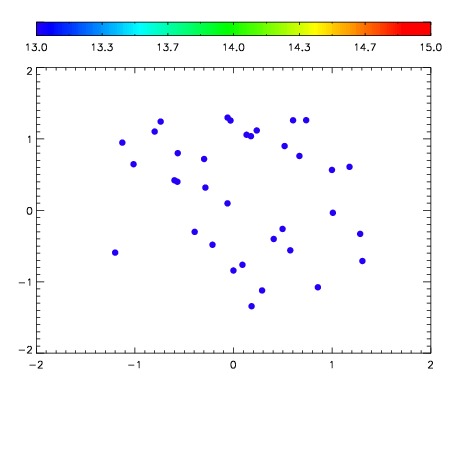

| Frame | Nreads | Zeropoints | Mag plots | Spatial mag deviation | Spatial sky 16325A emission deviations (filled: sky, open: star) | Spatial sky continuum emission | Spatial sky telluric CO2 absorption deviations (filled: H < 10) | |||||||||||||||||||||||
| 0 | 0 |
|
|
|
|
|
|
| IPAIR | NAME | SHIFT | NEWSHIFT | S/N | NAME | SHIFT | NEWSHIFT | S/N |
| 0 | 11440037 | 0.474207 | 0.00000 | 18.7161 | 11440038 | -0.00155896 | 0.475766 | 18.8349 |
| 1 | 11440032 | 0.473249 | 0.000958025 | 19.0131 | 11440031 | 0.00000 | 0.474207 | 19.0067 |
| 2 | 11440033 | 0.473749 | 0.000458002 | 19.0122 | 11440035 | -0.00174451 | 0.475952 | 18.9937 |
| 3 | 11440036 | 0.473698 | 0.000509024 | 18.8426 | 11440034 | -0.00150806 | 0.475715 | 18.9936 |