| Red | Green | Blue | |
| z | 17.64 | ||
| znorm | Inf | ||
| sky | -Inf | -NaN | -Inf |
| S/N | 24.5 | 44.0 | 45.8 |
| S/N(c) | 0.0 | 0.0 | 0.0 |
| SN(E/C) |
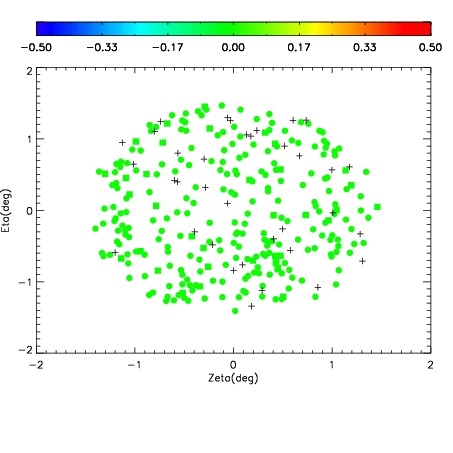
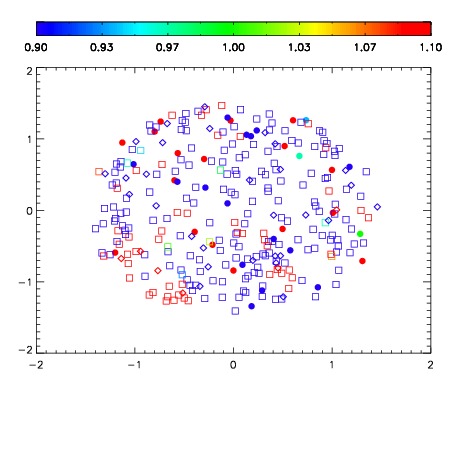
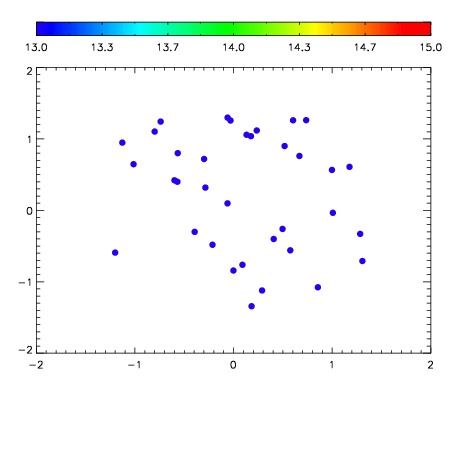

| Frame | Nreads | Zeropoints | Mag plots | Spatial mag deviation | Spatial sky 16325A emission deviations (filled: sky, open: star) | Spatial sky continuum emission | Spatial sky telluric CO2 absorption deviations (filled: H < 10) | |||||||||||||||||||||||
| 0 | 0 |
|
|
|
|
|
|
| IPAIR | NAME | SHIFT | NEWSHIFT | S/N | NAME | SHIFT | NEWSHIFT | S/N |
| 0 | 11670038 | 0.492299 | 0.00000 | 18.9303 | 11670036 | 0.00000 | 0.492299 | 18.9370 |
| 1 | 11670037 | 0.491946 | 0.000352979 | 18.9327 | 11670039 | -0.00388431 | 0.496183 | 18.9390 |
| 2 | 11670041 | 0.491254 | 0.00104499 | 18.8668 | 11670040 | -0.00379706 | 0.496096 | 18.9074 |
| 3 | 11670042 | 0.491356 | 0.000943005 | 18.8321 | 11670043 | -0.00263582 | 0.494935 | 18.7160 |