| Red | Green | Blue | |
| z | 17.64 | ||
| znorm | Inf | ||
| sky | -Inf | -Inf | -Inf |
| S/N | 26.0 | 44.7 | 47.5 |
| S/N(c) | 0.0 | 0.0 | 0.0 |
| SN(E/C) |
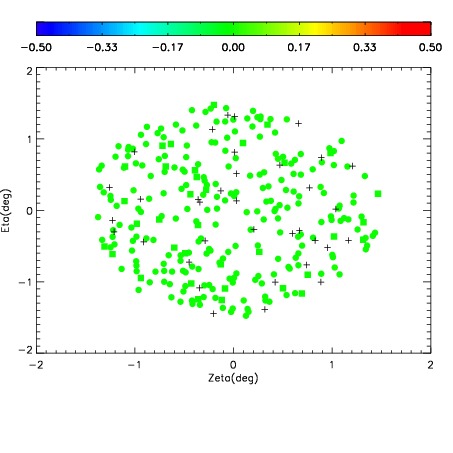
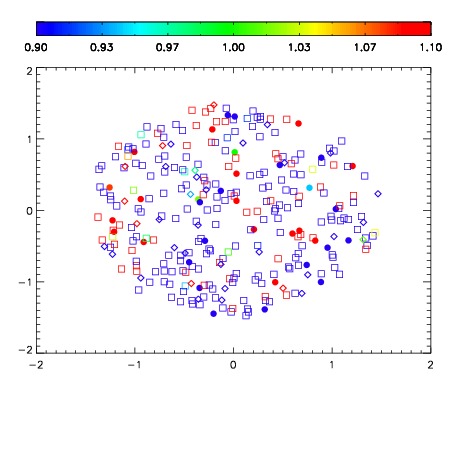
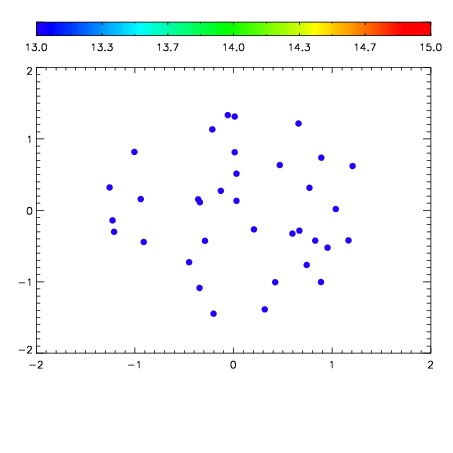

| Frame | Nreads | Zeropoints | Mag plots | Spatial mag deviation | Spatial sky 16325A emission deviations (filled: sky, open: star) | Spatial sky continuum emission | Spatial sky telluric CO2 absorption deviations (filled: H < 10) | |||||||||||||||||||||||
| 0 | 0 |
|
|
|
|
|
|
| IPAIR | NAME | SHIFT | NEWSHIFT | S/N | NAME | SHIFT | NEWSHIFT | S/N |
| 0 | 11360028 | 0.481684 | 0.00000 | 18.9909 | 11360026 | 0.00000 | 0.481684 | 18.9872 |
| 1 | 11360031 | 0.481173 | 0.000510991 | 18.9940 | 11360030 | -0.00128567 | 0.482970 | 19.0250 |
| 2 | 11360027 | 0.481567 | 0.000117004 | 18.9684 | 11360029 | -0.00117878 | 0.482863 | 18.9518 |
| 3 | 11360032 | 0.481287 | 0.000396997 | 18.9660 | 11360033 | -0.000747714 | 0.482432 | 18.9514 |