| Red | Green | Blue | |
| z | 17.64 | ||
| znorm | Inf | ||
| sky | -Inf | -Inf | -Inf |
| S/N | 23.3 | 41.2 | 44.7 |
| S/N(c) | 0.0 | 0.0 | 0.0 |
| SN(E/C) |
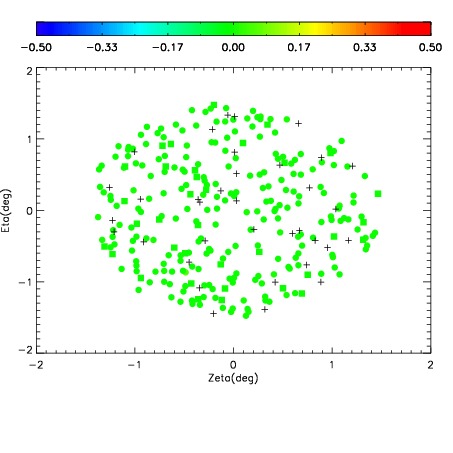
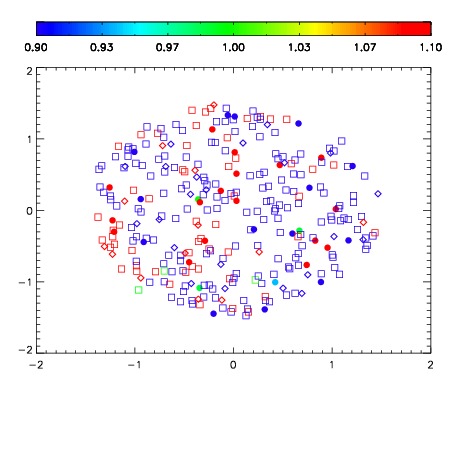
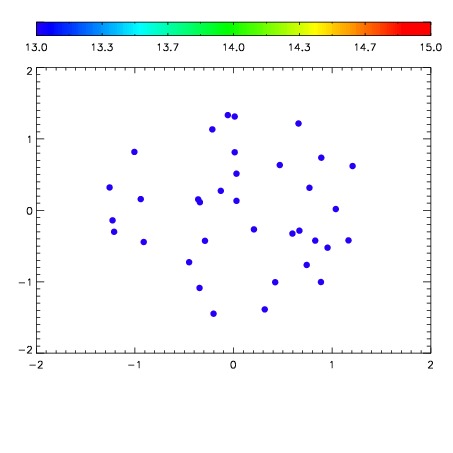

| Frame | Nreads | Zeropoints | Mag plots | Spatial mag deviation | Spatial sky 16325A emission deviations (filled: sky, open: star) | Spatial sky continuum emission | Spatial sky telluric CO2 absorption deviations (filled: H < 10) | |||||||||||||||||||||||
| 0 | 0 |
|
|
|
|
|
|
| IPAIR | NAME | SHIFT | NEWSHIFT | S/N | NAME | SHIFT | NEWSHIFT | S/N |
| 0 | 11410039 | 0.472719 | 0.00000 | 18.7741 | 11410040 | -0.000110256 | 0.472829 | 18.9596 |
| 1 | 11410034 | 0.472258 | 0.000461012 | 18.8196 | 11410037 | -0.00154967 | 0.474269 | 19.0385 |
| 2 | 11410038 | 0.472375 | 0.000344008 | 18.8051 | 11410036 | -0.00182959 | 0.474549 | 18.9988 |
| 3 | 11410035 | 0.471785 | 0.000934005 | 18.6277 | 11410033 | 0.00000 | 0.472719 | 18.6734 |