| Red | Green | Blue | |
| z | 17.64 | ||
| znorm | Inf | ||
| sky | -Inf | -Inf | -Inf |
| S/N | 19.2 | 35.4 | 38.1 |
| S/N(c) | 0.0 | 0.0 | 0.0 |
| SN(E/C) |
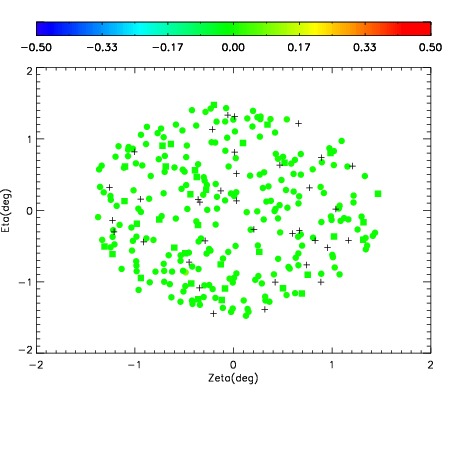
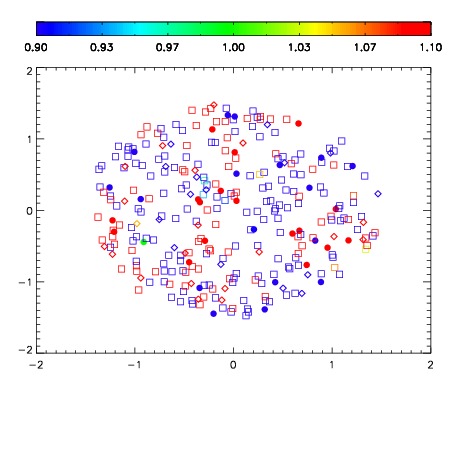
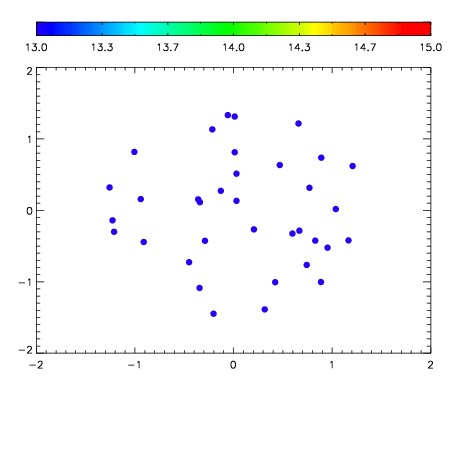

| Frame | Nreads | Zeropoints | Mag plots | Spatial mag deviation | Spatial sky 16325A emission deviations (filled: sky, open: star) | Spatial sky continuum emission | Spatial sky telluric CO2 absorption deviations (filled: H < 10) | |||||||||||||||||||||||
| 0 | 0 |
|
|
|
|
|
|
| IPAIR | NAME | SHIFT | NEWSHIFT | S/N | NAME | SHIFT | NEWSHIFT | S/N |
| 0 | 11420028 | 0.479334 | 0.00000 | 18.7346 | 11420029 | -0.000991098 | 0.480325 | 18.8012 |
| 1 | 11420027 | 0.478870 | 0.000463992 | 18.6714 | 11420026 | -0.000411301 | 0.479745 | 18.7206 |
| 2 | 11420024 | 0.478509 | 0.000824988 | 18.4210 | 11420025 | -0.000865346 | 0.480199 | 18.6953 |
| 3 | 11420023 | 0.478382 | 0.000952005 | 18.2454 | 11420022 | 0.00000 | 0.479334 | 18.0852 |