| Red | Green | Blue | |
| z | 17.64 | ||
| znorm | Inf | ||
| sky | -NaN | -NaN | -NaN |
| S/N | 22.4 | 39.5 | 41.6 |
| S/N(c) | 0.0 | 0.0 | 0.0 |
| SN(E/C) |
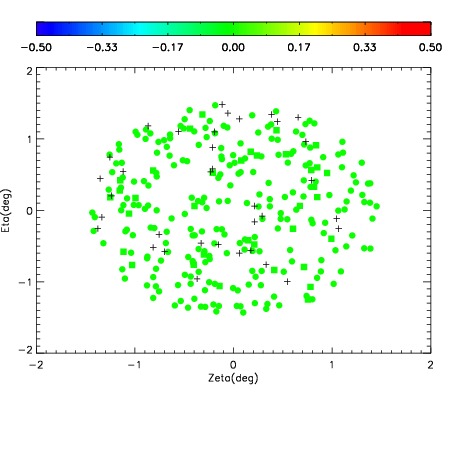
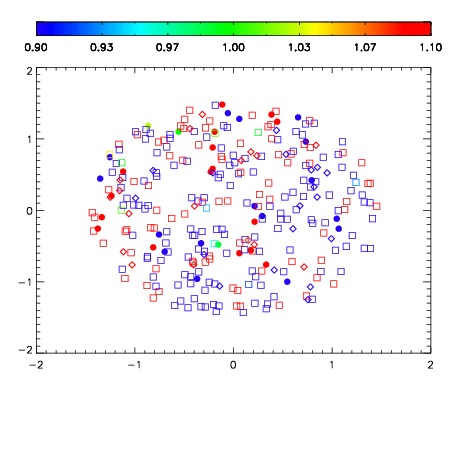
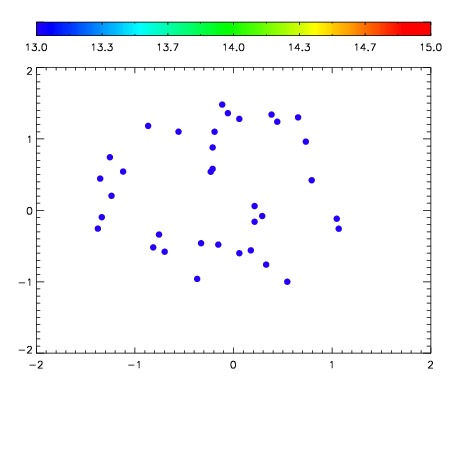

| Frame | Nreads | Zeropoints | Mag plots | Spatial mag deviation | Spatial sky 16325A emission deviations (filled: sky, open: star) | Spatial sky continuum emission | Spatial sky telluric CO2 absorption deviations (filled: H < 10) | |||||||||||||||||||||||
| 0 | 0 |
|
|
|
|
|
|
| IPAIR | NAME | SHIFT | NEWSHIFT | S/N | NAME | SHIFT | NEWSHIFT | S/N |
| 0 | 10910048 | 0.507655 | 0.00000 | 18.6704 | 10910046 | 0.00000 | 0.507655 | 18.7119 |
| 1 | 10910052 | 0.507093 | 0.000562012 | 18.9170 | 10910053 | -0.00413344 | 0.511788 | 18.9547 |
| 2 | 10910051 | 0.506982 | 0.000672996 | 18.8271 | 10910049 | -0.00303395 | 0.510689 | 18.7841 |
| 3 | 10910047 | 0.506948 | 0.000707030 | 18.6899 | 10910050 | -0.00274575 | 0.510401 | 18.7636 |